


Banyan Lane Capital has spent years covering cyclicals (old and new economy), and the pattern is always the same. Supply is constrained by long capex lead times. Demand swings on the global macro cycle. Capacity arrives 24 to 48 months after the price signal, exactly when the cycle has already turned. You make money by being early to the imbalance and patient through the lag.
The frustrating part of these trades has always been that demand eventually disappoints. Steel demand mean-reverts. Iron ore consumption peaks. Cardboard ships less when retail is slow. The supply story is real but the demand story is just a cycle around a flat-to-modest growth trend.
This thesis is exactly like the cyclical commodity setups we’ve all seen for years, with one critical difference: for once, there is a true secular demand driver underneath the cycle, and the emergence of product differentiation! The supply-side analysis is identical to copper or cardboard or anything else with long capex lead times. But the demand side is genuinely structural, driven by AI infrastructure buildout that has years left to run. That combination is unusually attractive.
This note also leans on the three-axis framework Banyan Lane uses for evaluating opportunities. A great trade typically lines up on at least two of these. This one lines up on all three:
Cyclical: The MLCC industry is in the early phase of a multi-year up-cycle. Lead times have stretched from 8 weeks to 24-40 weeks. Price hikes were announced April 2026 (Murata +15-35% on AI/auto-grade) and May 2026 (Taiyo Yuden +6-13%). Samsung Electro-Mechanics is signaling 5-10%. This cycle is not a forecast - it is happening now.
Secular: AI compute demand is creating a new product category (high-cap, hi-rel MLCCs for power delivery on accelerators) that did not meaningfully exist five years ago. NVIDIA’s Blackwell NVL72 rack uses ~441,000 MLCCs. The upcoming Rubin VR200 NVL72 is estimated at ~600,000+. This is structural, not cyclical.
Idiosyncratic: Murata-specific factors that don’t apply to peers, including ~60% share of AI-server-specific MLCCs (vs. ~40% overall MLCC share), the cleanest US-listed exposure (MRAAY, an ADR), a ¥150B buyback announced May 2026 retiring ~4% of shares, and a culturally conservative guidance practice that sets up serial beat-and-raise quarters.
A few of the figures in this note are estimates or triangulations from industry data, customer disclosures, and the SemiAnalysis ecosystem. Where exact numbers are not publicly disclosed (specifically AI MLCC volumes and ASPs by tier, and Murata’s AI-specific market share), we’ve built bottom-up estimates using BoM disclosures, server unit forecasts, and announced price hikes. These are flagged where relevant. Happy to take better inputs if you have them!
An important caveat on share assumptions: Murata’s overall MLCC share is roughly 40% (a disclosed industry figure). Their share specifically of AI-server-grade MLCCs is harder to verify and is the single largest sensitivity in this thesis. Industry sources put it between 50% and 70% depending on what you count. Banyan Lane uses 60% as the working assumption throughout this note, with explicit downside scenarios at lower share. The math works at 60%. It still works at 50%. Below that, the thesis weakens materially.
Reading time: ~30 minutes.
Note: additional reading suggested by Nutty (@nuttycld), who covers the technicals very well and beat me to the punch.
Part 1: The Punchline Up Front
Murata Manufacturing (Tokyo: 6981.T, ADR: MRAAY) is currently a roughly $65 billion market cap Japanese components company (similar in scale to Lam Research). It produces ceramic capacitors, an old, slow-growing, mostly commodity industry. The stock trades around $15.41 on the ADR (¥5,138 in Tokyo) as of early May 2026.
Banyan Lane’s view is that Murata’s earnings power by FY28 (March 2029) is 40-90% above current Wall Street consensus at a 60% AI MLCC share assumption. FY28E EPS lands at ¥307 vs. consensus implying ~¥210, driven by an asymmetric supply/demand setup in high-end MLCCs that the market has not yet fully credited.
Two valuation lenses, both pointing the same direction:
P/E framework on FY28E EPS ¥307:
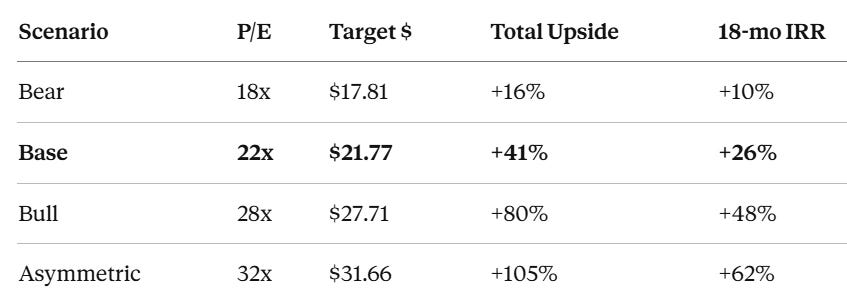
Base case (22x): MRAAY $21.77, +41% upside, ~26% annualized IRR over 18 months
Bull case (28x): MRAAY $27.71, +80% upside, ~48% IRR
Asymmetric (32x): MRAAY $31.66, +105% upside, ~62% IRR
EV/EBITDA framework on FY28E EBITDA ¥819B / $5.3B:
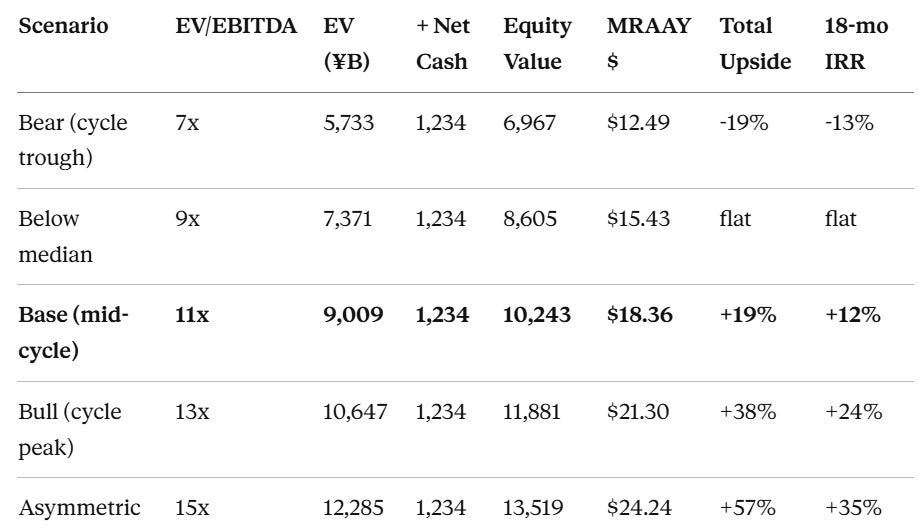
Base case (11x, mid-cycle median): MRAAY $18.36, +19% upside, ~12% IRR
Bull case (13x, cycle peak): MRAAY $21.30, +38% upside, ~24% IRR
Asymmetric (15x, structural rerate): MRAAY $24.24, +57% upside, ~35% IRR
Note these are point-in-time targets on FY28E earnings power. The 18-month IRR assumes the market starts crediting that earnings power as the beat-and-raise dynamic plays out through 2026-2027 prints, well before FY28 actually closes.
Three things make the potential upside larger than the headline target prices suggest:
MLCCs are a trivial share of AI server BoM. A Blackwell rack with 441,000 MLCCs at peak ASP of roughly $0.30 each is only $130,000 of MLCCs in a $4 million GPU box. That is 3% of BoM at the absolute high-water mark. If Murata pushed prices another 50-100% on AI parts, hyperscalers would still pay rather than lose AI training share for a fraction of a percent of total cost. The pricing assumptions in Banyan Lane’s model are deliberately conservative. Murata president Norio Nakajima has publicly stated that customer inquiries for the company’s MLCCs are running at roughly twice their available supply capacity (Bloomberg, early 2026). When demand is 2x supply, the supplier sets the price.
Lead time and qualification dynamics in this market are more like memory than people realize. A new high-end MLCC line takes 24 to 30 months from capex commitment to first revenue. Existing line capacity expansion takes 18 months. Customer qualification on top of that adds another 6 to 12 months. Compared to DRAM/HBM, which most investors are watching closely, MLCC is faster and cheaper to add but the absolute supply is also dramatically smaller and more concentrated. The cycle should be durable.
Capacity expansion timing favors Murata in the near term. Murata announced its Izumo plant in March 2024 and started shipping in April 2026 (25 months). SEMCO’s Korean expansion was announced in 2025 and is not expected to ship until mid-2027. SEMCO’s Philippines (Calamba City) line started ramping early 2026 but is smaller. SEMCO’s Tianjin plant has been running 24/7 at full capacity since early 2026 with no expansion room. This means Murata’s share of AI MLCCs likely rises modestly in 2027 before SEMCO’s bigger Korean expansion catches up in 2028. The model holds 60% throughout to be conservative.
Part 2: What’s an MLCC, and Why Should You Care?
A multilayer ceramic capacitor (MLCC) is a tiny battery that charges and discharges thousands of times per second. Its job is to keep voltage steady when a chip suddenly demands more power.
Analogy: Think of a capacitor as a small water tank next to a faucet. When you turn the tap, you don’t want the pressure to drop. The tank releases water immediately, then refills slowly from the main pipe. Modern AI chips pull enormous amounts of current and need stable voltage delivered with microsecond precision. So they need hundreds of thousands of these tiny tanks placed right next to them.
The MLCC market is structurally split into two products that share a name but are fundamentally different businesses:
Type Capacitance Where it goes Price each Maker count Commodity MLCC 0.001 to 1 µF Toasters, cars, smartphones, everything $0.0003 to $0.003 20+ globally High-end MLCC 10 to 470 µF High-performance chips, AI servers, EV inverters $0.05 to $0.50 3 to 4 globally
That’s a 100 to 1,000x price spread between the two. They are called the same thing but are as different as a Toyota Corolla and a Ferrari. The Corolla is built from parts you can buy from anyone. The Ferrari has specialty components from one of three workshops in the world.
This distinction is the entire investment thesis.
Part 3: The Macro and Micro Structure of Supply and Demand
This market is unusual because it has both macro and micro economic structures that work in favor of the highest-end producers.
Macro Structure
At the commodity end of the market, supply is elastic. If demand rises, Yageo, Walsin, Sunlord, and a dozen other Taiwanese and Chinese players can add capacity in 12 to 18 months. Pricing power is limited. This is a normal cyclical commodity business.
At the high-end (AI server, automotive grade, high-cap parts), supply is structurally inelastic. Only Murata, Samsung Electro-Mechanics, and to a lesser extent Taiyo Yuden and TDK can produce them. The reason is that making a 100 µF MLCC the size of a grain of sand requires stacking 500 to 1,000 ceramic layers, each less than a micron thick. The yield curve is brutal. Every 100 layers added drops yields by 5-10%. The dielectric powder (barium titanate) comes from 3 to 4 qualified suppliers globally. The stacking equipment comes from one company, Toray. From capex commitment to first revenue is 24 to 30 months.
So when AI demand spikes, no one can add high-end capacity for two years. This is a oligopolistic supply structure inside a market that looks competitive at the surface.
TrendForce’s framing of the current moment is useful: “Leading suppliers such as Murata, along with other major high-end Japanese and Korean manufacturers, are largely adhering to a ‘profit-first’ strategy. Competitive price bidding has become more disciplined to preserve overall ASP levels.” The high-end producers are coordinated on price, not competing.
Micro Structure: The Demand Side
The micro story is where the secular driver lives.
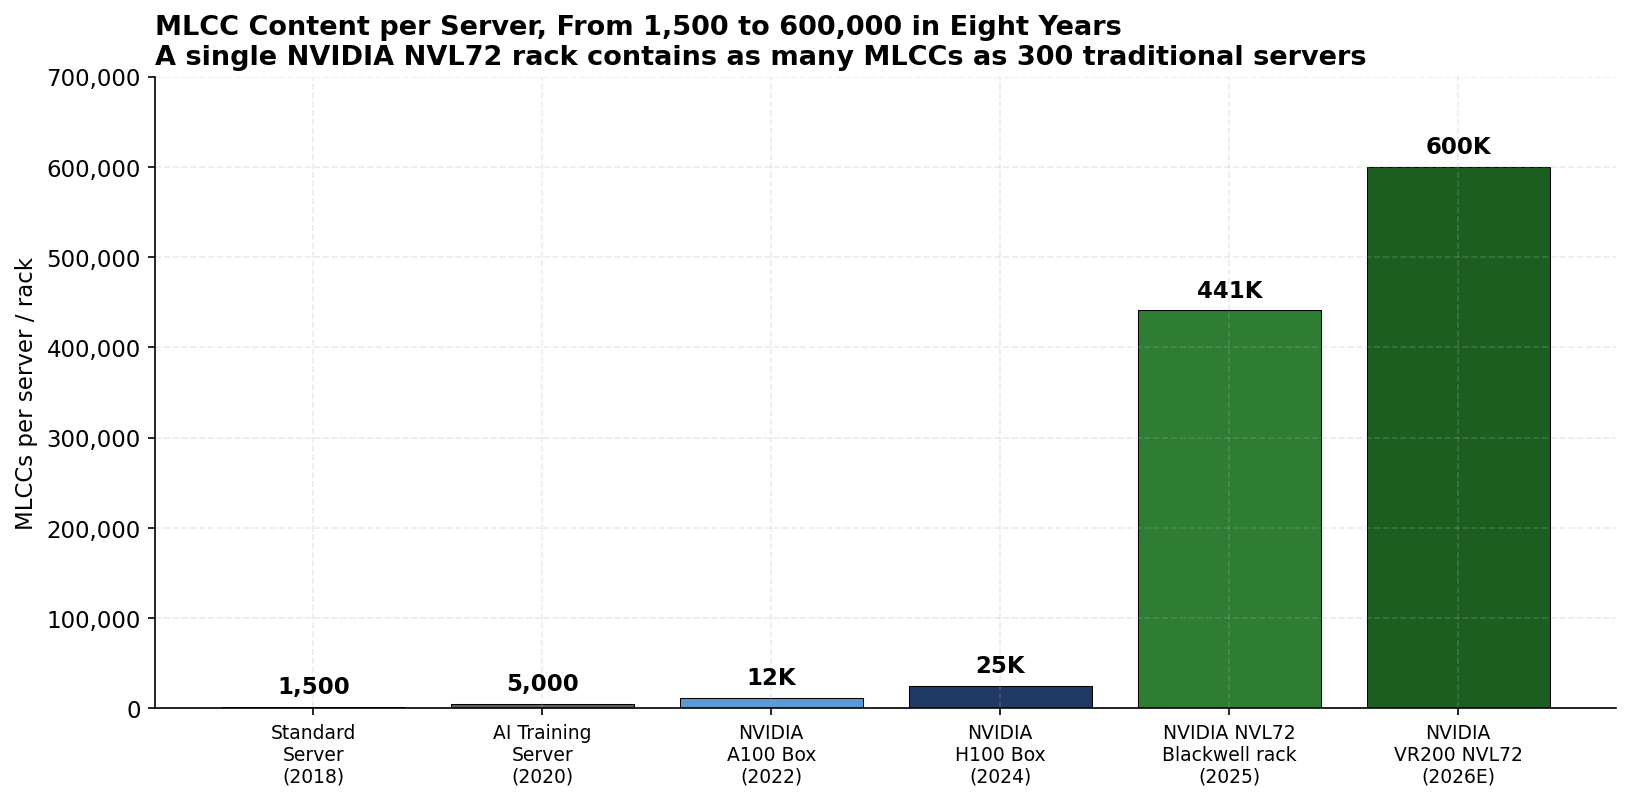
A standard server in 2018 had about 1,500 MLCCs. An NVIDIA H100 box has 25,000. A Blackwell NVL72 rack has 441,000. Rubin (VR200 NVL72), shipping next year, is estimated at 600,000+ (Korean media reports, ~30% above GB300 platform). That’s a single rack containing as many MLCCs as 300 traditional servers.
Why so many? Because a Blackwell GPU draws about 1,000 watts at less than 1 volt. That’s over 1,000 amps of current swinging on and off thousands of times per second. Every nanosecond of voltage instability is a computational error or a thermal event. The only way to deliver clean power at that scale is hundreds of thousands of capacitors arranged in a precision power delivery network around the chips.
The Supply/Demand Math
Here is what the market has yet to discount. The chart below shows AI server MLCC demand vs. supply in billions of units per year, plus the net balance (negative = deficit).
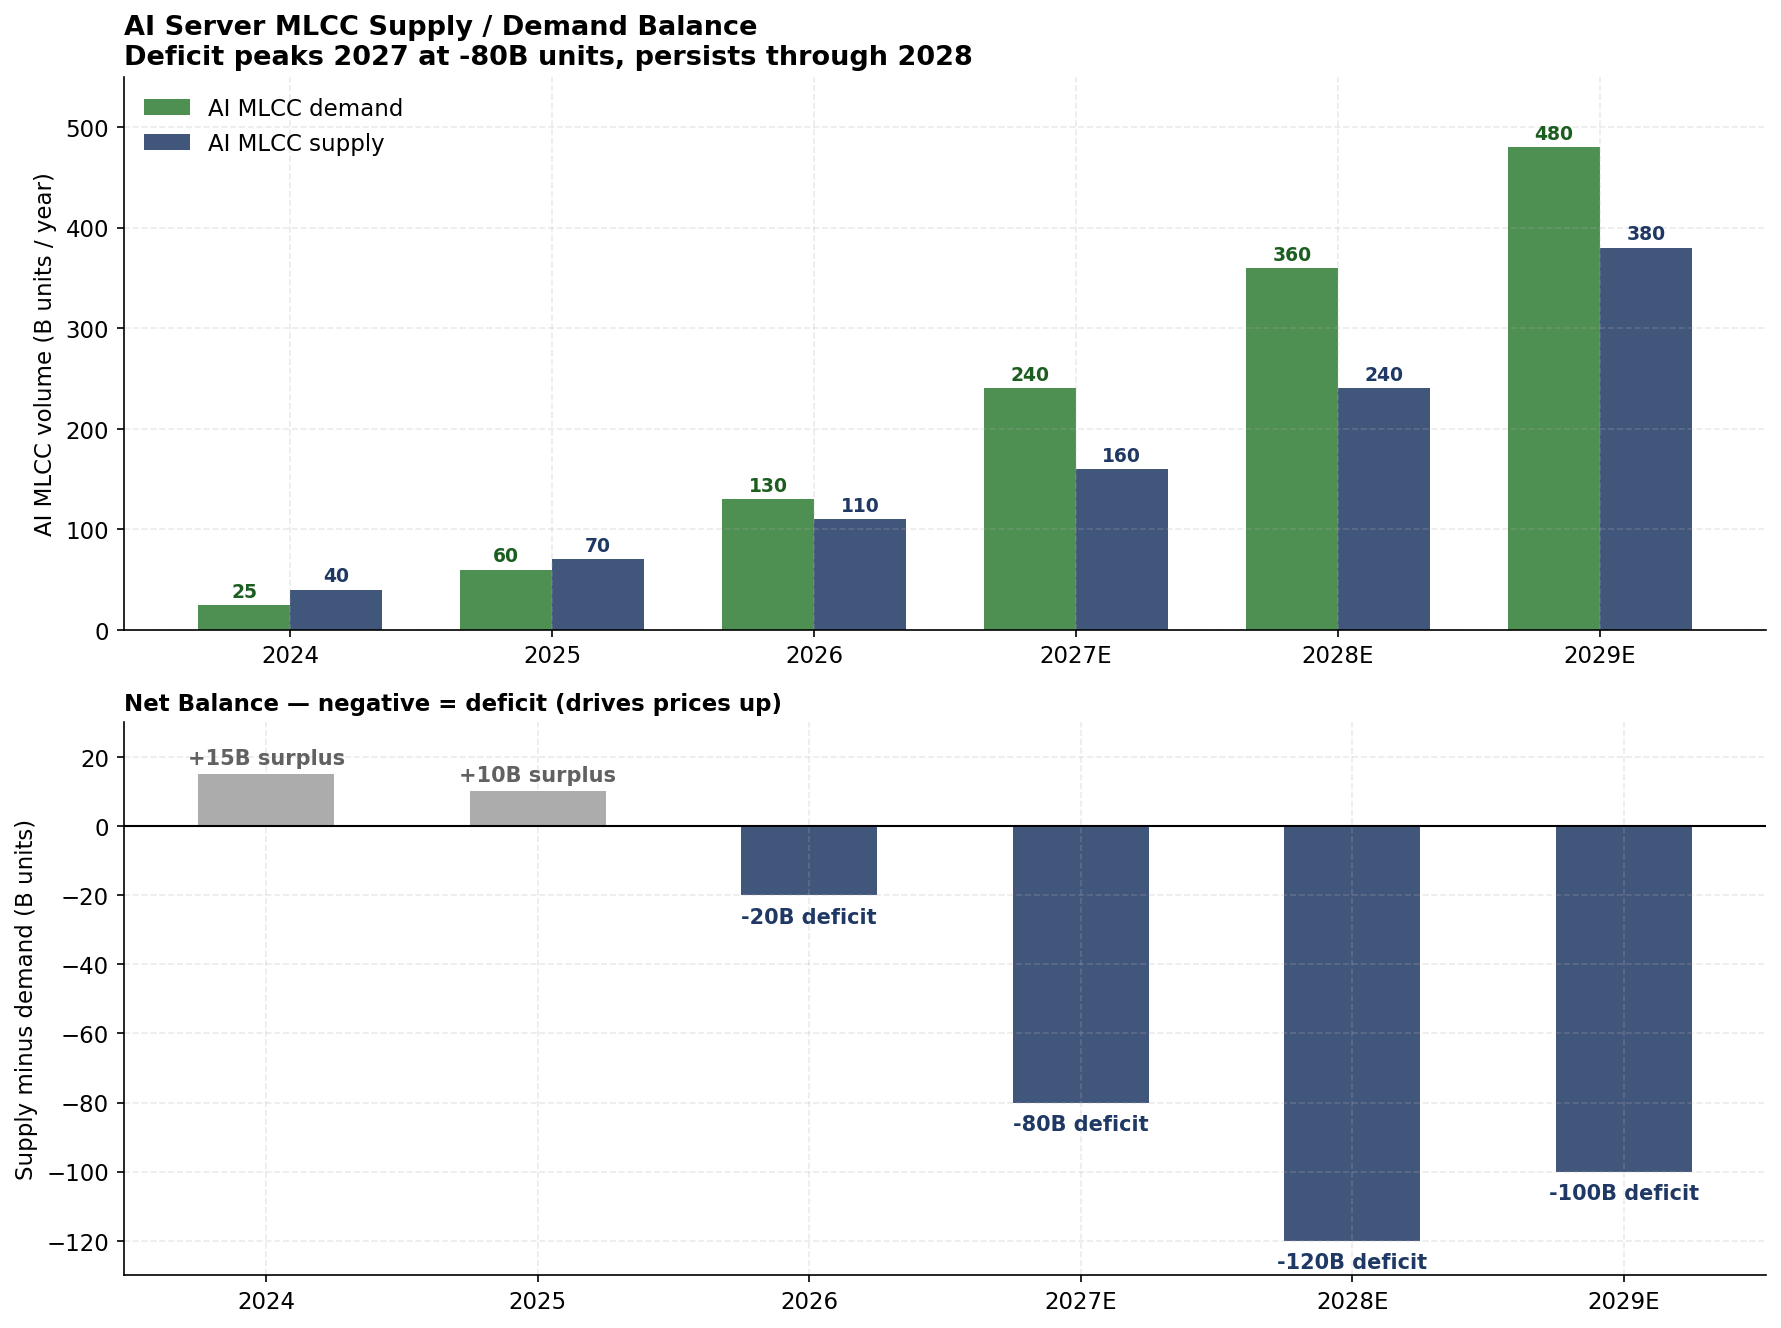
The 2024 and 2025 picture was balanced or slight surplus. The shift happened in 2026. As Blackwell volumes ramped and Rubin orders entered the queue, demand jumped from roughly 60 billion units to 130 billion units in a year. Supply, constrained by physical capacity, only rose from 70 to 110 billion units. The market flipped from surplus to a 20 billion unit deficit.
Banyan Lane’s model has the deficit peaking at roughly 120 billion units in 2028 before new capacity from Murata’s Izumo plant and SEMCO’s Korean expansion starts to close the gap in 2029. This is a 3 to 4-year shortage. Long enough for sustained price increases. Short enough that the trade has a defined endpoint to position around.
Lead Times and Pricing Hikes Are Already Happening
This is not a forecast. The cycle has begun.
Lead times: Stretched from 8 weeks (normal) to 24 to 40 weeks (current) through 2026 (TrendForce, Murata customer notices)
April 1, 2026: Murata raises AI/auto-grade MLCC prices 15-25%
May 2026: Taiyo Yuden raises 6-13%
April-May 2026: Samsung Electro-Mechanics signaling 5-10% hikes, with discussions ongoing with major clients
TrendForce data: AI server MLCC spot prices up 15-20% year-to-date 2026, projected up 30-40% for the full year on high-end parts
SEMCO Q1 2026 print: Operating profit up 39.9% YoY, pursuing long-term supply agreements with Big Tech, launched 47µF MLCC for AI servers (double prior capacity)
The price signal is in the market. Banyan Lane’s model assumes these price increases flow through to reported financials with a 1 to 2 quarter lag, which means the first earnings prints showing the impact will be in late July 2026 (Murata Q1 FY27).
Part 4: Time and Cost to Add Supply (Why This Cycle Lasts)
Many investors are watching DRAM and HBM closely. Memory has had massive price moves and is the more famous AI shortage story. So a useful comparison is: how does adding MLCC capacity compare to adding DRAM/HBM capacity?
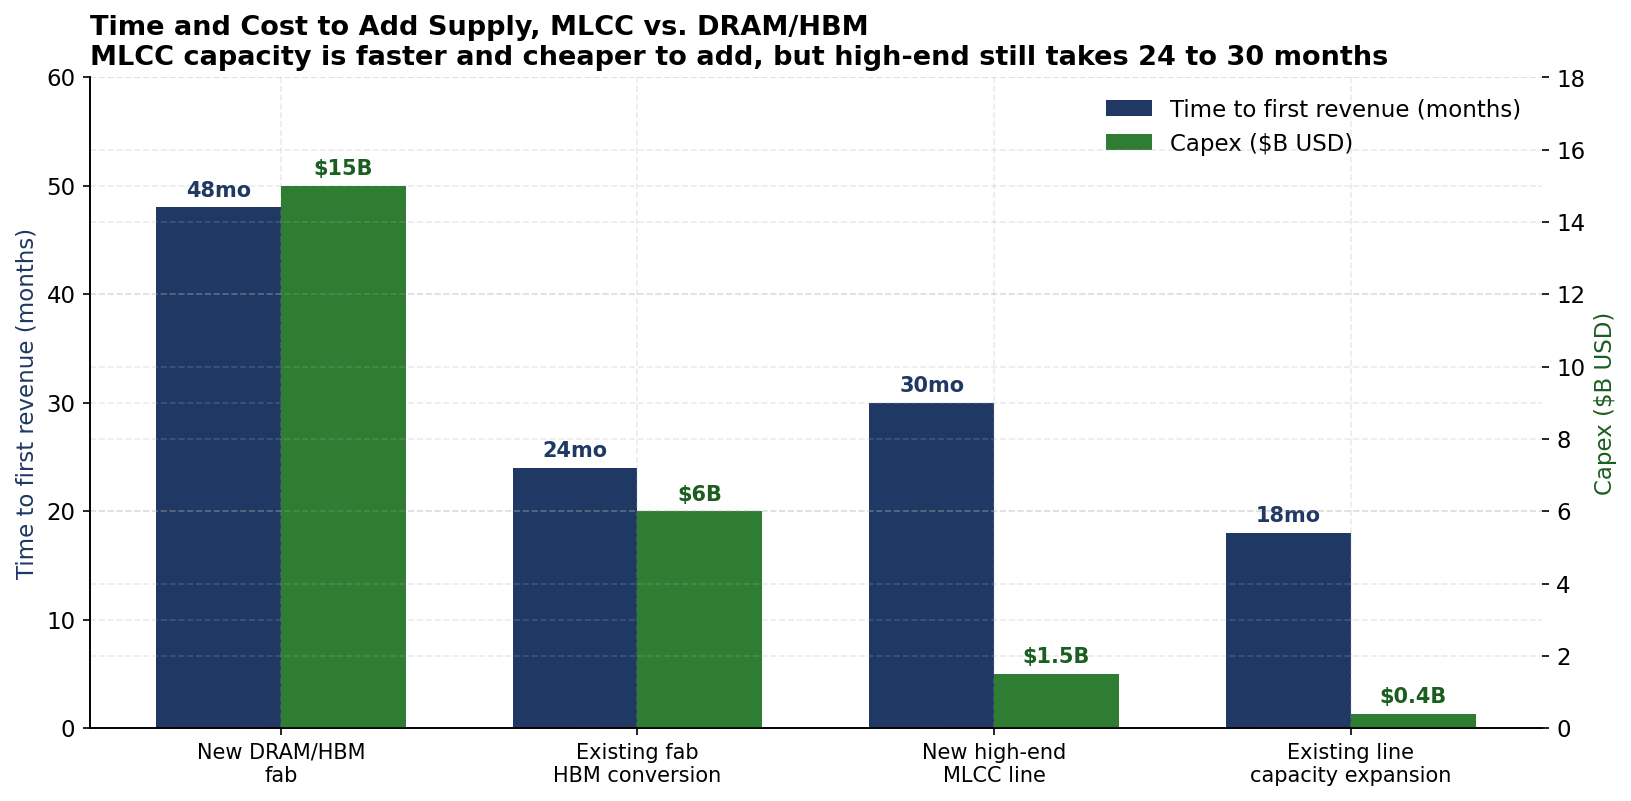
A few observations:
MLCC capacity is faster and cheaper to add than DRAM/HBM. A new high-end MLCC line costs roughly $1.5 billion and takes 30 months. A new HBM-capable DRAM fab costs $9 to $15 billion and takes 4 years (Micron’s $9.6B Hiroshima fab, announced May 2024, expected first output 2028 per Nikkei reports).
That’s the bear case for MLCCs. Capacity will arrive faster than in DRAM. The cycle will be shorter.
But the absolute supply is dramatically smaller and more concentrated. There are only 3 to 4 companies in the world that can make AI-grade MLCCs. There are 5 to 6 companies that can make HBM. More importantly, MLCCs do not have a substitute path within the same product. DRAM has a known “node migration” path where existing fabs deliver more bits per wafer through process improvements. MLCCs do not have an analogous yield-gain path. Adding bits per fab is constrained by the physical layer-stacking process. (We will discuss the OUT-OF-CATEGORY substitute path, eDTC and HD-MiM, in the risk section. That’s a real long-term threat but not a near-term one.)
And here is the kicker: Murata announced its Izumo plant in March 2024 and started shipping in April 2026 (25 months). SEMCO’s Korean expansion was announced in 2025 and is expected to ship mid-2027. Even with the price signal screaming since 2024, the actual capacity additions land in 2026 to 2027 and won’t ramp meaningfully until 2028. The shortage cannot be fixed inside the thesis horizon. That’s what makes the cycle durable.
For perspective on the math: total AI-capable MLCC industry capacity today is roughly 80 to 110 billion units per year, of which 50-60% is contracted to non-AI uses (auto, industrial, medical). Available for AI is maybe 30 to 50 billion units. AI MLCC demand in 2026 is already at 130 billion units and rising fast. There is no near-term supply response possible. That structural scarcity, in front of a multi-year secular demand driver, is the entire trade.
Part 5: The Pricing Lesson From History
In 207-2082018 Apple was launching the iPhone X. Japanese suppliers were exiting low-end MLCC production to focus on high-margin parts. Demand exploded, supply was stuck, and the high-end ASP for a reference part (100 µF / 0402 X5R) went from $0.04 to $0.30 in 18 months, a 7.5x move.
It crashed back when Chinese capacity arrived in 2019, but only commodity capacity. The high-end stayed elevated. The 2022 cycle (5G, COVID, EV) saw a smaller move because supply had been added in the meantime.
Now look at the blended industry ASP across 15 years:
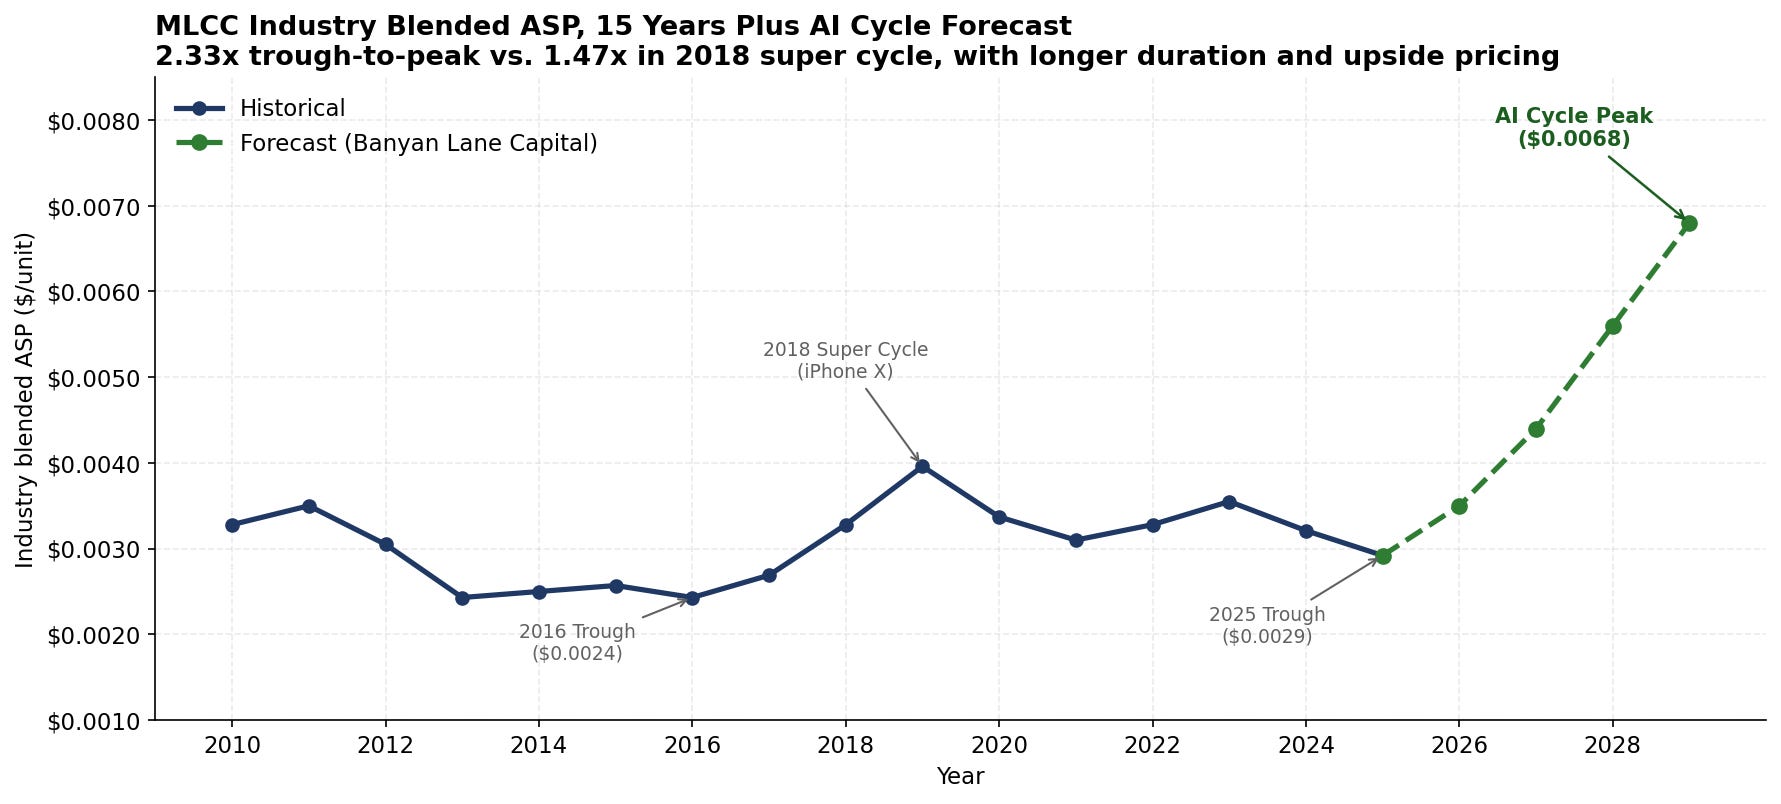
The blue line shows the historical industry blended ASP. It has been rangebound at $0.0024 to $0.0040 for fifteen years. The 2018 super cycle pushed it from $0.0027 to $0.0040, a 1.47x move over two years.
The green dashed line is Banyan Lane’s forecast. From the 2024 trough of $0.0029, blended ASP rises to $0.0061 by 2029E. That’s 2.07x, meaningfully above 2018.
Why higher than 2018? Three structural reasons:
Mix shift, not commodity price hikes. In 2018, commodity ASPs spiked because of capacity tightness. This cycle, commodity stays flat-to-up modestly. The pricing is happening in the high-end, where AI MLCC ASPs go from $0.10 to $0.30+ per unit. As high-end mix rises in the blended number, blended ASP doubles even if commodity barely moves.
AI is structural demand, not a single product cycle. The iPhone X drove the 2018 cycle. AI infrastructure is a multi-year buildout across multiple generations of accelerators. Duration matters: a 4-year cycle accumulates more cumulative ASP gains than a 2-year cycle.
Customer concentration favors suppliers, not buyers. In 2018, Apple eventually negotiated MLCC prices down by playing suppliers against each other. In 2026, six hyperscalers are spending $300B+ on capex and panic-locking long-term agreements at the offered prices. None will lose AI training share to save 0.01% of capex on capacitors. This is the reverse dynamic of 2018.
The pricing assumption is justified by the supply/demand imbalance. Now let’s see what happens when we run that through a real income statement.
Part 6: Why Murata Specifically?
There are five real players in MLCCs globally.
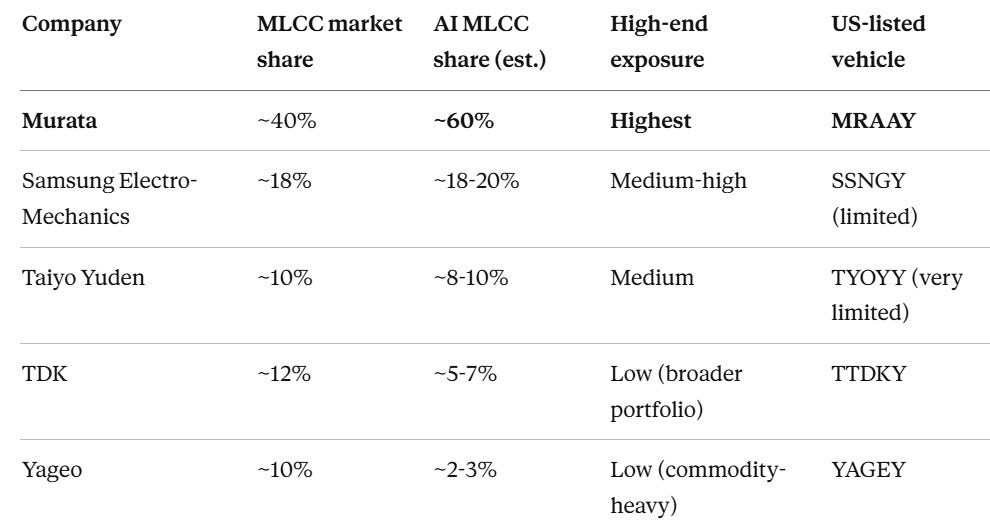
Market shares triangulated from industry reports, TrendForce data, and customer BoM disclosures. AI MLCC share specifically is the largest data uncertainty in this thesis. Banyan Lane uses 60% for Murata; the model would still work at 50% and weakens materially below that.
Murata is the cleanest play. They have spent the last decade walking away from the lowest tier of the commodity market and pouring capex into high-end. Industry sources estimate they hold around 60%of AI-server-specific MLCCs (with some sources putting this as high as 70% for the very highest-cap parts). Their cleanroom infrastructure (Class 100-1000), proprietary BaTiO3 powder synthesis, and 1,000-layer stacking technology is genuinely 1 to 2 nodes ahead of anyone else.
Samsung Electro-Mechanics is interesting for operating leverage (lower margin base means more cycle torque). SEMCO’s Q1 2026 print showed operating profit up 39.9% YoY with revenue crossing ₩3.21T (~$2.2B) for the first time in company history. They launched a 47µF MLCC for AI servers, doubling prior capacity. Their CEO is positioning the company as the “World’s Only AI Core Component Solutions Provider,” which signals price discipline rather than commoditization. They are pursuing long-term supply agreements with Big Tech, not undercutting on price. SEMCO is following Murata’s playbook, not breaking it.
Taiyo Yuden has higher beta in absolute terms but the stock is illiquid in the US (TYOYY <20K shares/day with 8% spreads).
For US investors, MRAAY is the cleanest expression. Approximately 150,000 shares per day of liquidity, 5 to 10 basis point spreads, and 0.5 ADR ratio (one ADR equals half a Tokyo share). The Tokyo direct (6981.T) is preferable for institutional sizing where liquidity matters more.
The idiosyncratic axis is also where the most concentrated upside lives:
AI MLCC is becoming most of Murata’s earnings. In FY24A, the MLCC division was roughly 50% of revenue. By FY28E in Banyan Lane’s model, MLCC is 67% of revenue and roughly 90% of operating profit. AI MLCC alone reaches 25% of revenue. This is operating leverage from a single product line that no peer can match.
Net cash balance sheet of roughly $8 billion, supporting buybacks. The May 2026 ¥150B buyback retires roughly 4% of shares.
Conservative guidance culture. Murata has historically guided 15-25% below initial-year actuals in cycle years. The April 2026 FY27 guide of ¥380B operating profit looks deliberately conservative against the price hikes already announced.
Capacity expansion timing. Murata’s Izumo plant is shipping now (April 2026). SEMCO’s larger Korean expansion is mid-2027. This 12-18 month head start should let Murata gain 1-3 share points in 2027 before settling back.
Part 7: Building the Income Statement Bottom-Up
The thesis stands on three legs: volume × ASP × margin. Each is built explicitly so the model is falsifiable.
Step 1: Revenue from volume × ASP
Banyan Lane splits Murata’s MLCC business into three product categories with completely different unit economics:
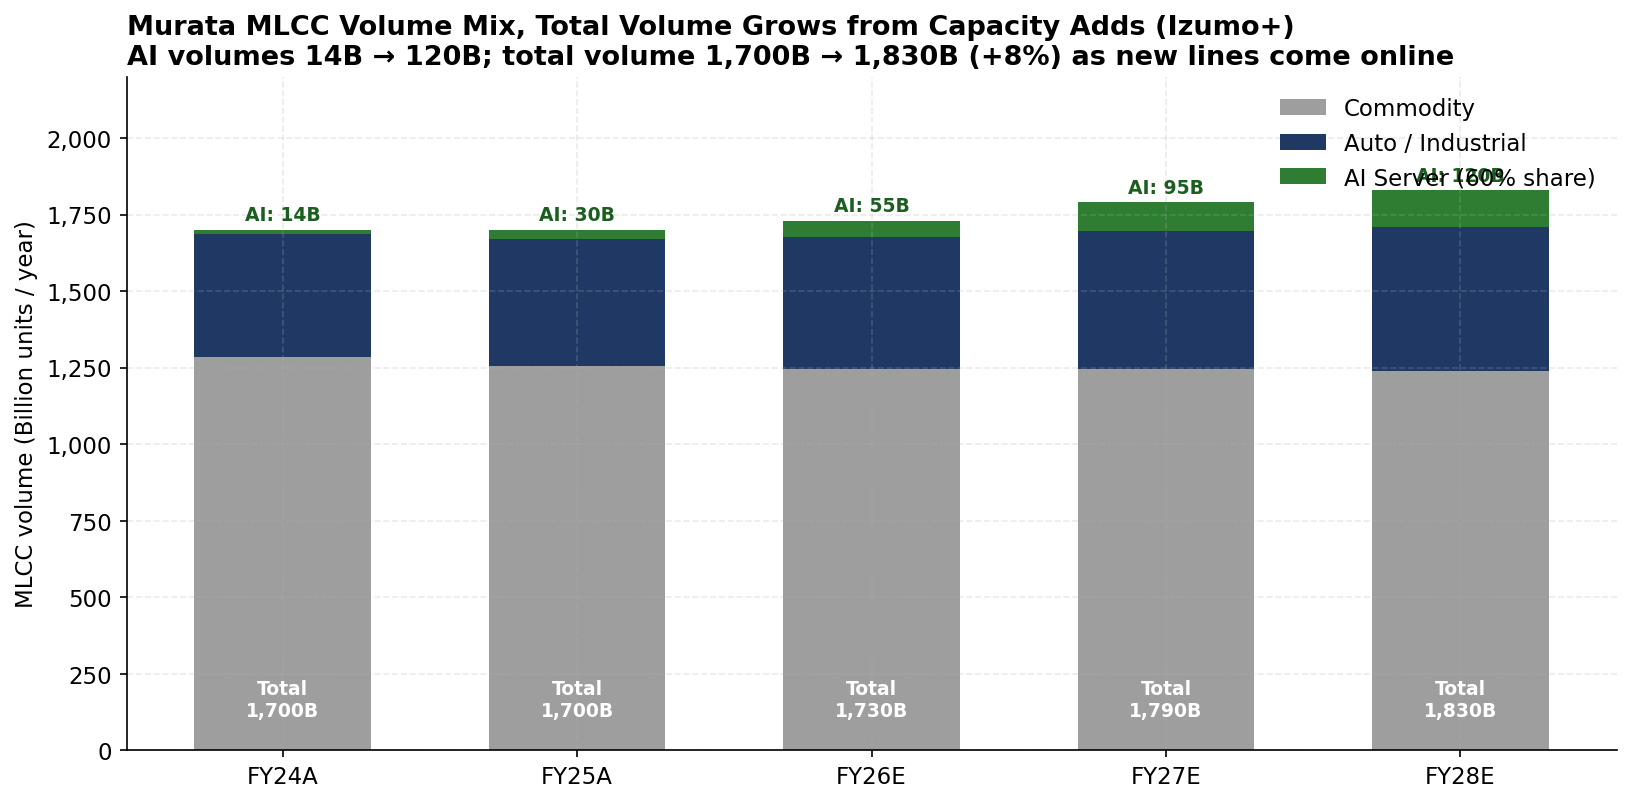
Total Murata MLCC volume grows from 1,700B to 1,830B units, an 8% expansion driven by the Izumo plant ramp and follow-on capacity additions. This is not a story about Murata “selling many more MLCCs” but rather about volume growing modestly while mix shifts dramatically. What changes dramatically is the mix:
AI server MLCCs: 14B units (FY24A) to 120B units (FY28E) at 60% AI MLCC share. 8.5x growth.
Auto/industrial: 400B to 470B. EV and ADAS demand drives 18% growth.
Commodity: 1,286B to 1,240B. Murata stays in commodity selectively but lets the bottom of the market churn.
ASP per category:
AI MLCC ASP: ¥3.0 to ¥5.2 per unit. Reflects Apr-26 price hikes (15-35%) plus a likely second round in 2027 if shortage persists. Conservative vs. the BoM-share argument.
Auto MLCC ASP: ¥0.92 to ¥1.18. EV demand drives modest pricing power.
Commodity ASP: ¥0.32 to ¥0.37. Stable.
Blended ASP rises from ¥0.48 to ¥0.92 per unit, a 92% increase. Volume grows 8%. So MLCC division revenue grows from ¥821B to ¥1,611B, a 18% CAGR.
When stacked with the other Murata segments (non-MLCC components, Devices & Modules, Other), total revenue grows from ¥1,638B to ¥2,372B (or $10.6B to $15.3B in USD at 155), a 10% CAGR.
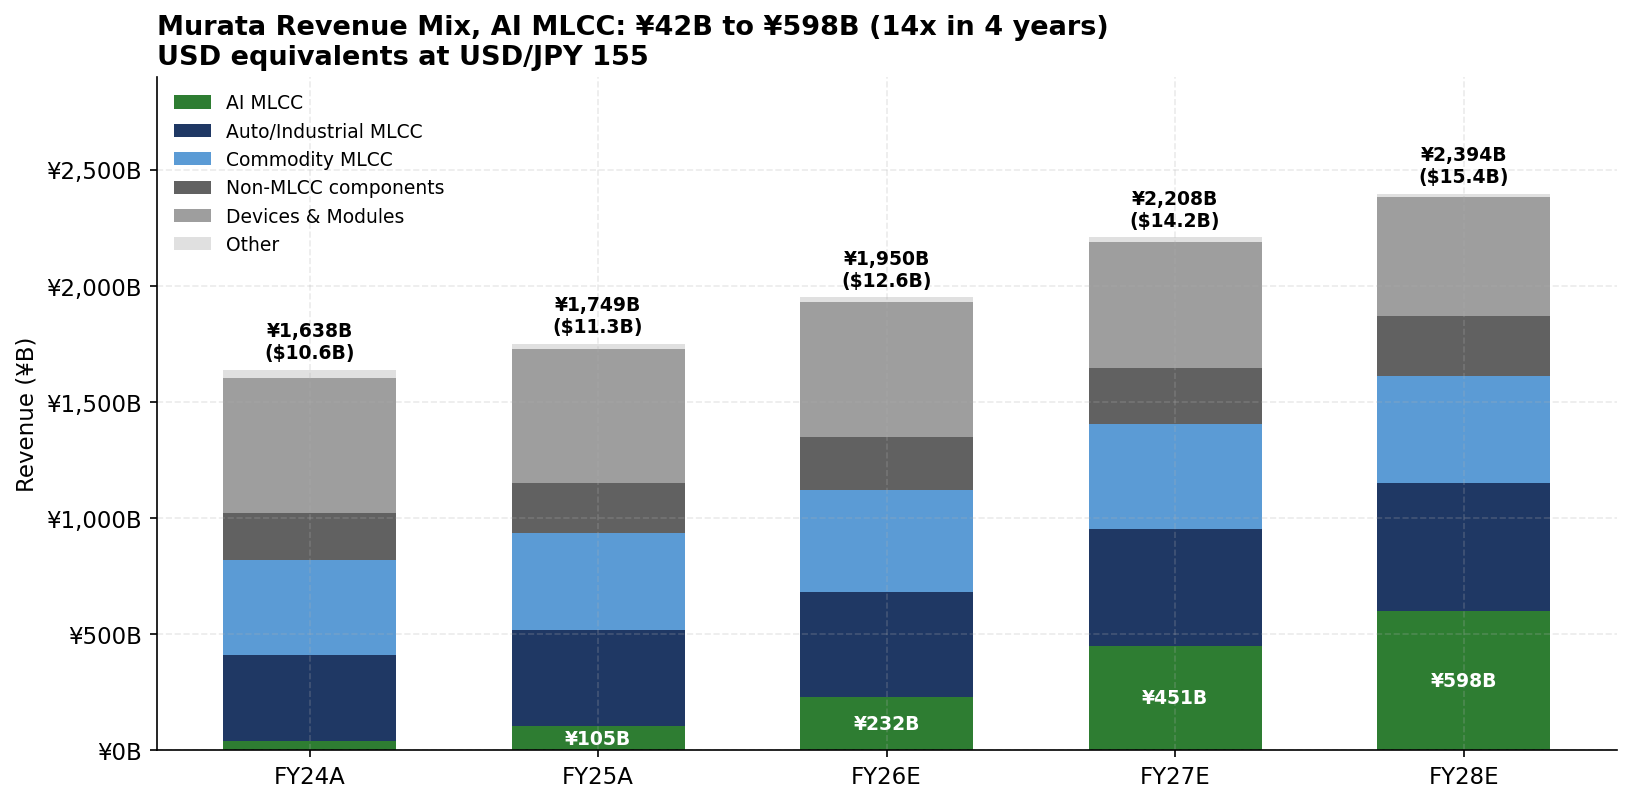
The shape is what matters. AI MLCC goes from a sliver to the largest single revenue category. Devices & Modules (the lower-margin, lower-growth piece, including the SAW filter business they just took an impairment on) shrinks. The mix is shifting toward Murata’s best products.
Step 2: Gross Profit per Unit (Where the Thesis Lives)
This is the structural story:
A single AI MLCC sells for ¥3.0 today and costs about ¥1.50 to make, a 50% gross margin. By FY28E, ASP rises to ¥5.2 and the cost structure stays roughly stable around ¥1.55 (yield improvements offset by complexity). Gross profit per unit goes from ¥1.50 to ¥3.65, a 2.4x expansion in absolute gross profit per unit. Gross margin moves from 50-70%.
This is what defines a structural cycle: price rising faster than cost. You don’t get this in commodity businesses where price compression and cost compression race each other. You get it when supply is genuinely constrained and the buyer cannot substitute.
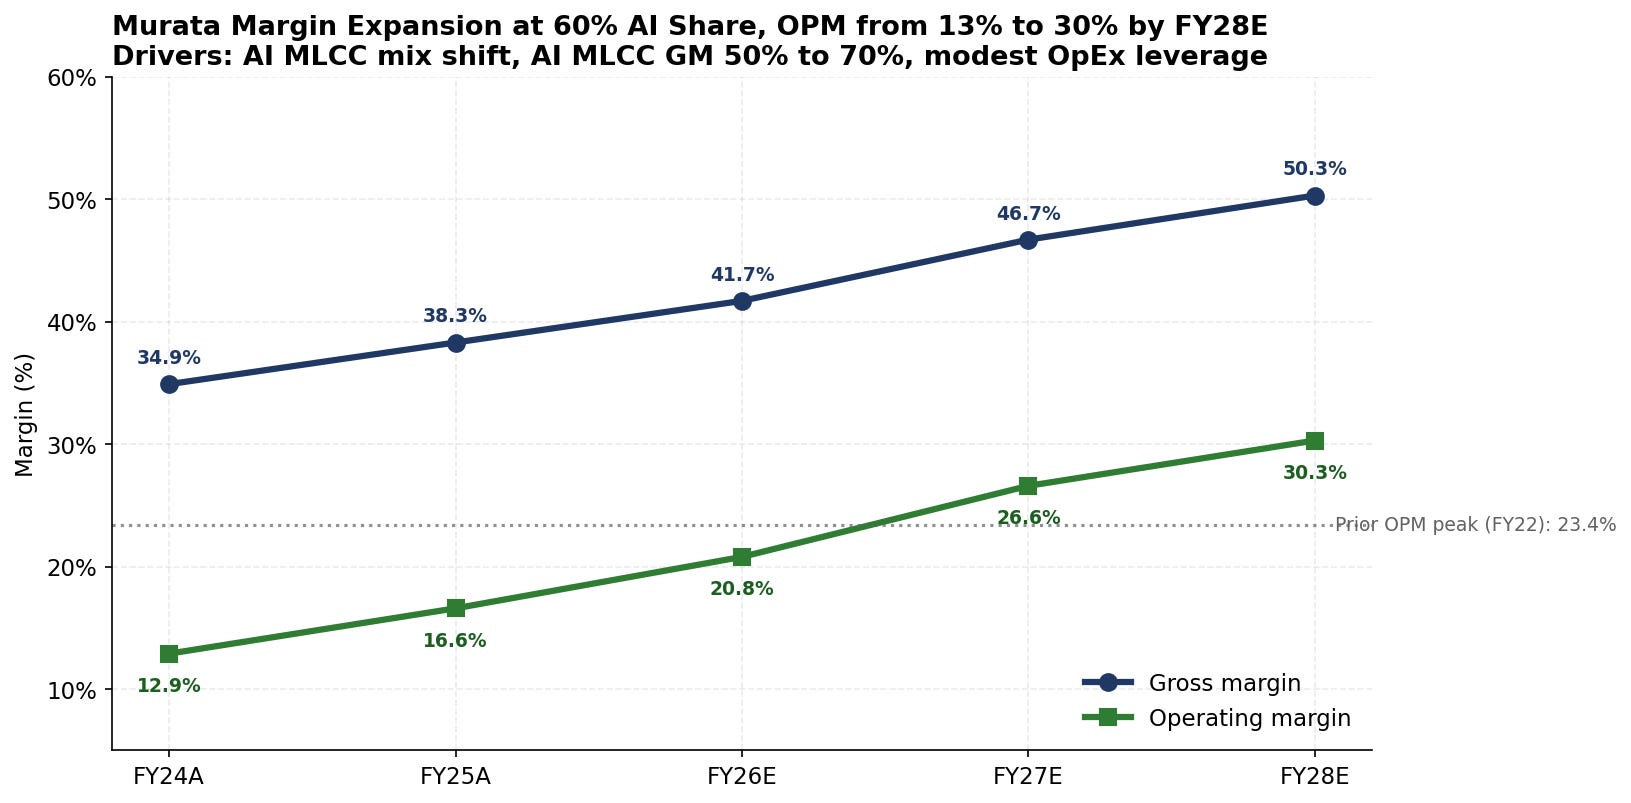
When Banyan Lane aggregates the per-segment gross profits, the company-wide gross margin moves from 35% to 50% over four years.
Step 3: Operating Expenses (in Absolute Dollars, Not %)
Most cycle models assume operating expenses scale with revenue at a fixed percentage, resulting in underestimating margin expansion. SG&A and R&D grow in absolute terms but slower than revenue, because Murata is producing more output from existing infrastructure rather than building a new sales force or doubling R&D headcount.
Absolute OpEx assumptions:
SG&A: ¥150B to ¥200B (7.5% CAGR)
R&D: ¥125B to ¥180B (9.5% CAGR, investing in AI MLCC capacity)
D&A: ¥80B to ¥130B (12.9% CAGR, capex ramp drives D&A growth)
Other: ¥5B flat
Total OpEx grows from ¥360B to ¥515B, a 9% CAGR vs. revenue growing at 10%. That gap is the operating leverage (and is arguably quite conservative).
Step 4: Operating Margin (Derived, Not Assumed)
The result:
Operating margin moves from 13% in FY24A to 30% in FY28E. That’s well above Murata’s prior peak (FY22: 23.4%). For context, that prior peak was driven by a normal cyclical recovery. This cycle’s margin peak is structurally higher because the underlying MLCC mix is structurally more profitable.
Step 5: Net Income and EPS
Below the operating line:
Net financial income: ~¥3 to 5B/year (Murata has $7-8B net cash, earns interest)
One-time items: FY25A had a ¥43.8B SAW filter goodwill impairment. Strips out for FY26+.
Tax rate: 23-25% (Japan corporate rate is 30%, Murata gets R&D credits)
Minority interest: ~¥4 to 6B/year
Diluted shares: 1.95B today, going to 1.80B by FY28E (¥150B buyback announced May 2026)
Net income: ¥149B to ¥552B (or $1.0B to $3.6B USD). 3.7x in four years.
EPS: ¥77 to ¥307. 4x in four years. 41% CAGR.
This is the entire engine. Volume × ASP × margin × buyback equals the EPS trajectory. At 60% AI MLCC share. The model is conservative.
Part 8: Cash Generation (Why a Capital-Intensive Business Deserves Better)
Murata is a capital-intensive business. They are spending ¥220B+ per year on capex (raised from a ¥100B target back in 2022). That capex shows up as growing depreciation, which reduces reported earnings. P/E framework alone undersells what’s actually happening.
The honest way to look at this kind of business is EBITDA and free cash flow:
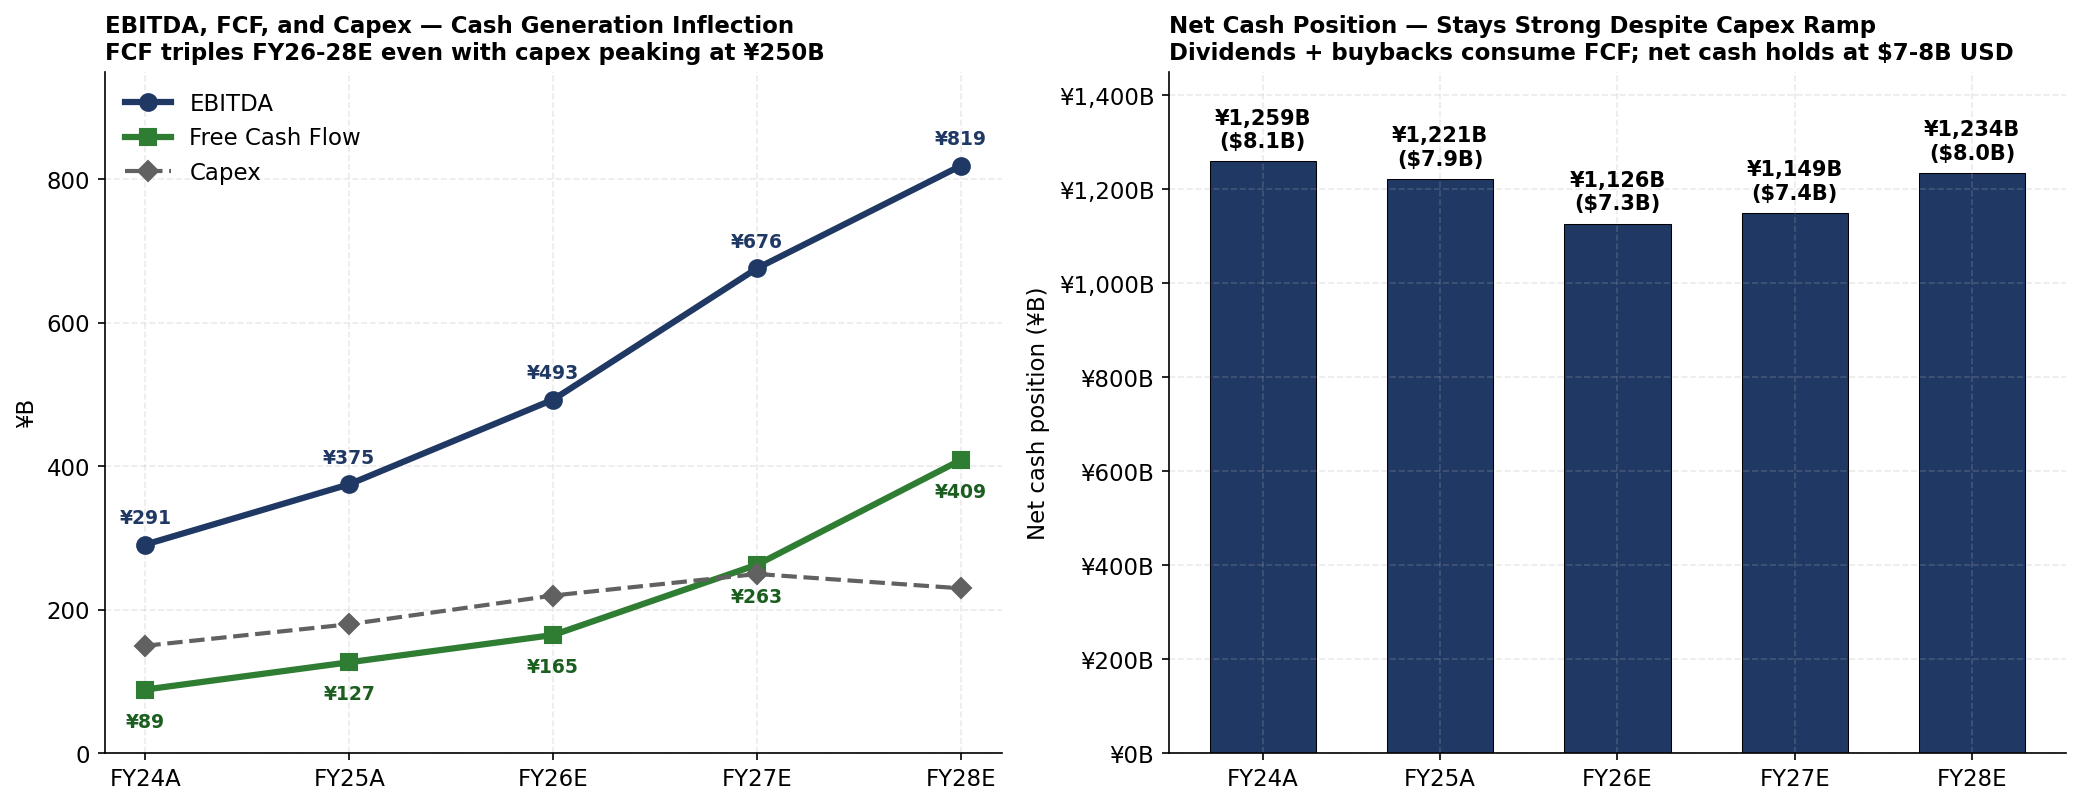
Three observations:
1. EBITDA grows 2.8x in four years. From ¥291B to ¥819B (or $1.9B to $5.3B USD). The EBITDA margin expands from 18% to 35%. That’s the cycle leverage compounded over four years.
2. FCF grows nearly 5x even with capex peaking at ¥250B. From ¥89B (FY24A) to ¥409B by FY28E. FCF margin rises from 5.4% to 17.3%. By FY28E, Murata generates ¥409B (~$2.6B USD) of free cash flow per year, equivalent to a ~4% FCF yield on the current $65B market cap. Not high yet, but trending right.
3. Net cash holds at $7-8B USD throughout the cycle. Capex consumes ~¥250B. Dividends ramp with earnings (~¥175B by FY28E). The ¥150B May-26 buyback and follow-on capital return programs absorb the rest. Net result: net cash position stays roughly stable through the heavy investment phase, then starts inflecting up post-2028 as capex tapers.
The result is even after ~$1.6bn of capital returns to shareholders (dividend + repurchases) each year going forward, or ~2.5% on current market cap, the business will be materially underlevered. While we have incorporated no upside for incremental returns to shareholders, the current wave in Japan pushing corporates to deploy cash efficiently might yield another larger buyback being implemented on top of what we have already forecasted.
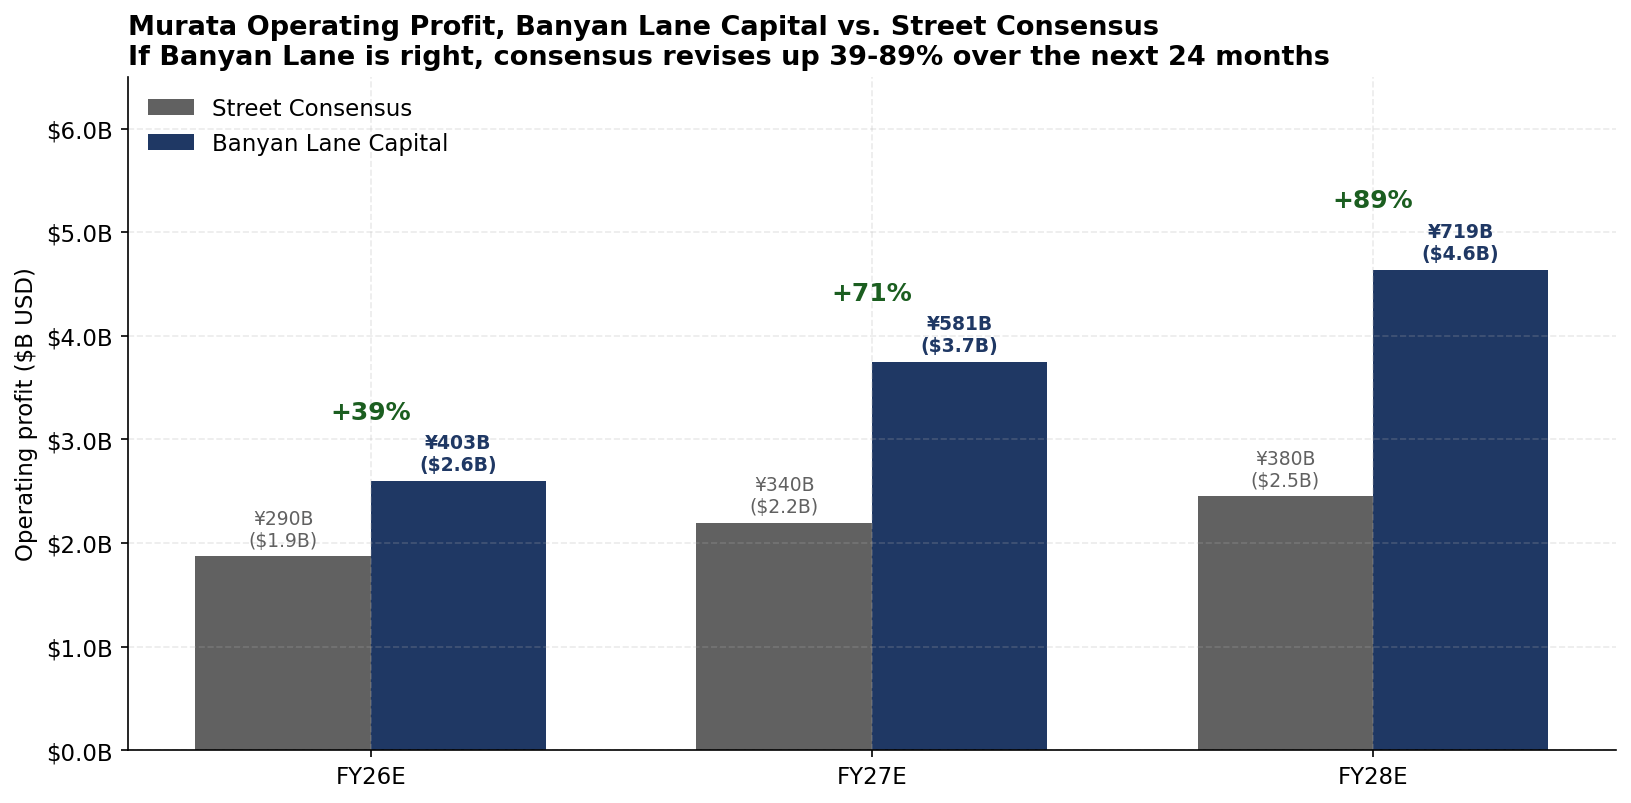
Compare the Banyan Lane model to current Street consensus:
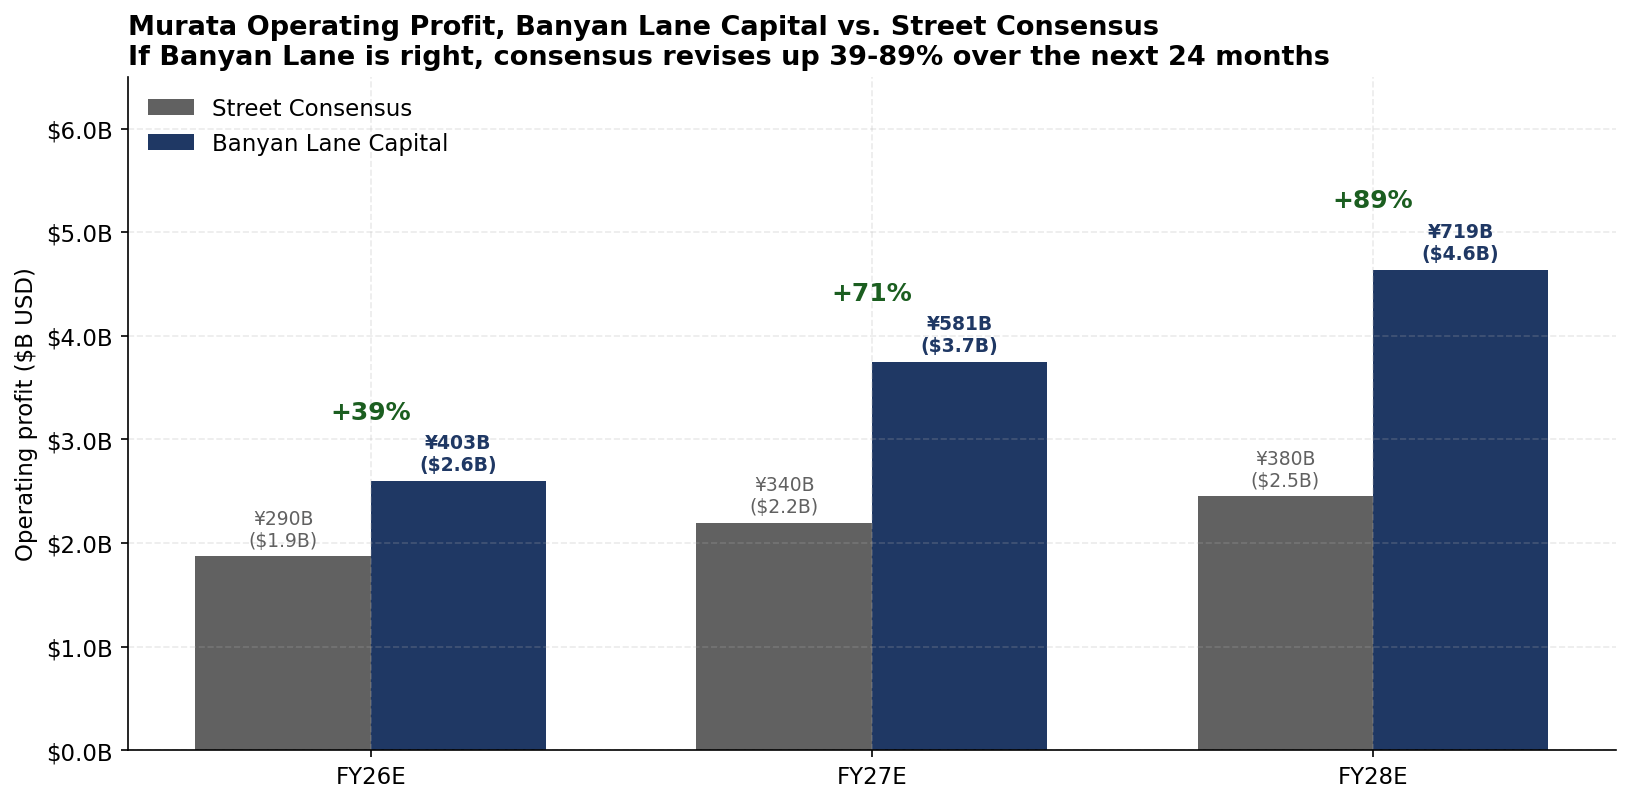
Why is the gap so wide?
First, consensus is anchored on Murata’s own conservative guidance. Murata guided FY27 OP of ¥380B in late April 2026. Japanese companies notoriously guide conservatively. Murata in particular has a history of beating initial forecasts by 15 to 25% in cycle years.
Second, the price hikes aren’t fully in numbers yet. Murata’s April 1, 2026 hikes (15 to 35% on AI/auto-grade) flow through with a 1 to 2 quarter lag. The first prints showing the impact will be late July 2026 (Q1 FY27). Those prints will very likely surprise to the upside, with consensus revisions following.
Third, AI MLCC volume ramp is faster than consensus models. Street estimates AI server MLCC content per box, but most models assume 25,000 to 50,000 MLCCs per AI server. The reality on Blackwell NVL72 is 441,000 per rack, and Rubin estimates are 600,000+. The arithmetic implies 2 to 3x more AI MLCC volume than consensus carries.
Fourth, mix shift to high-end is faster than modeled. Consensus assumes gradual mix shift. Reality is hyperscaler procurement teams locking long-term agreements at high-end specs, which pulls mix shift forward.
Fifth, the second round of hikes isn’t priced in. More than likely there will be another 25-30% AI MLCC ASP increase between mid-2026 and end-2027 if shortage persists. Murata’s customer demand running at 2x available supply and SEMCO already signaling LTAs at premium pricing both suggest this is realistic.
The setup: Murata earnings power is ¥719B operating profit by FY28E ($4.6B USD). Consensus is at ¥380B ($2.5B USD). One of these is wrong.
Part 10: The Valuation - Two Lenses
Lens 1: P/E Framework
FY28E EPS of ¥307. Murata has historically traded between 18x and 32x forward earnings:
18x: Cycle troughs, when markets price the business as a commodity
22x: Long-term mean
28x: Cycle peaks, when markets price normal earnings power
32x: Special situations (HBM-style “this is a structural rerate” multiples)
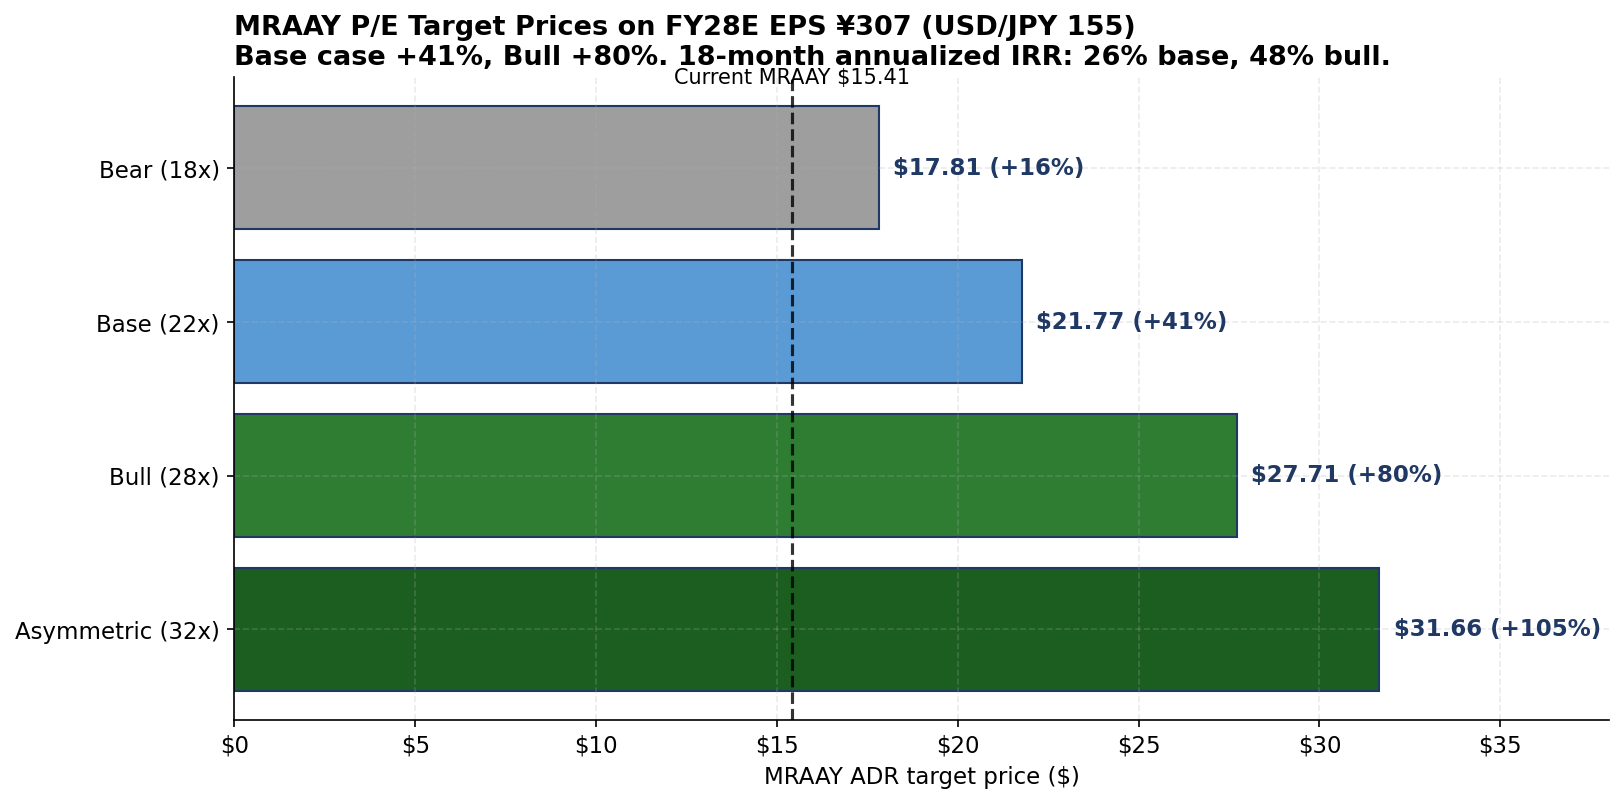
At MRAAY ~$15.41 (USD/JPY 155, 0.5 ADR ratio):
Lens 2: EV/EBITDA Framework
For a capital-intensive business that’s investing heavily, EV/EBITDA is arguably the more appropriate framework. Murata’s 10-year EV/EBITDA range is 5.2x to 15.2x. Current ~9.0x is mid-cycle on TTM, which means the market is currently pricing Murata at its long-run median multiple despite a structural mix shift in front of it.
On Banyan Lane’s FY28E EBITDA of ¥819B ($5.3B), here’s how the multiples translate:
Reconciling the Two Lenses
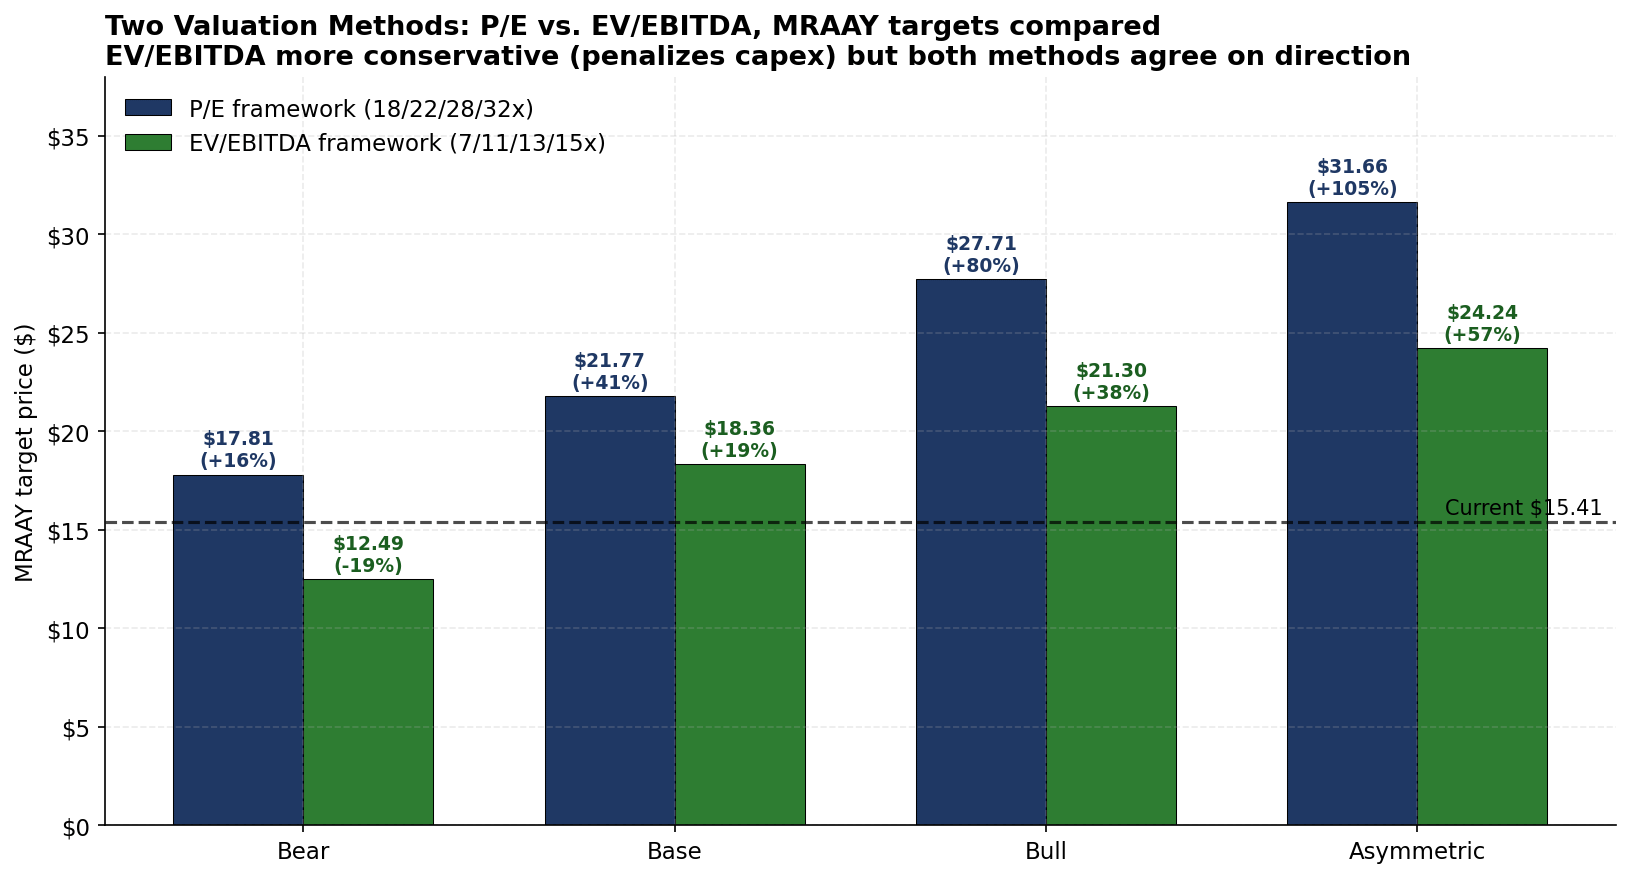
The two frameworks point in the same direction but EV/EBITDA gives more conservative absolute targets:
Why the gap? Murata is in heavy capex ramp. D&A is growing at at 13% CAGR vs. revenue growing 10%. EBITDA captures this; reported earnings get artificially boosted as the depreciation lags the actual cash burden of building out capacity.
The EV/EBITDA framework is more honest for a capital-intensive business and gives you a cleaner read on cash earning power. A reasonable way to triangulate: the EV/EBITDA bull case ($21.30 at 13x cycle peak) is roughly equivalent to the P/E base case ($21.77 at 22x mean). Both methods agree the stock is worth roughly $20+ on reasonable FY28E numbers.
In market cap terms, the MRAAY base cases imply $77B-92B USD market cap (vs. current $65B). Bull cases imply $90B-117B. Asymmetric cases imply $102B-133B.
Part 11: Munger Inversion - How This Could Fail
Charlie Munger always said: “Invert, always invert. Tell me where I’ll die so I don’t go there.”
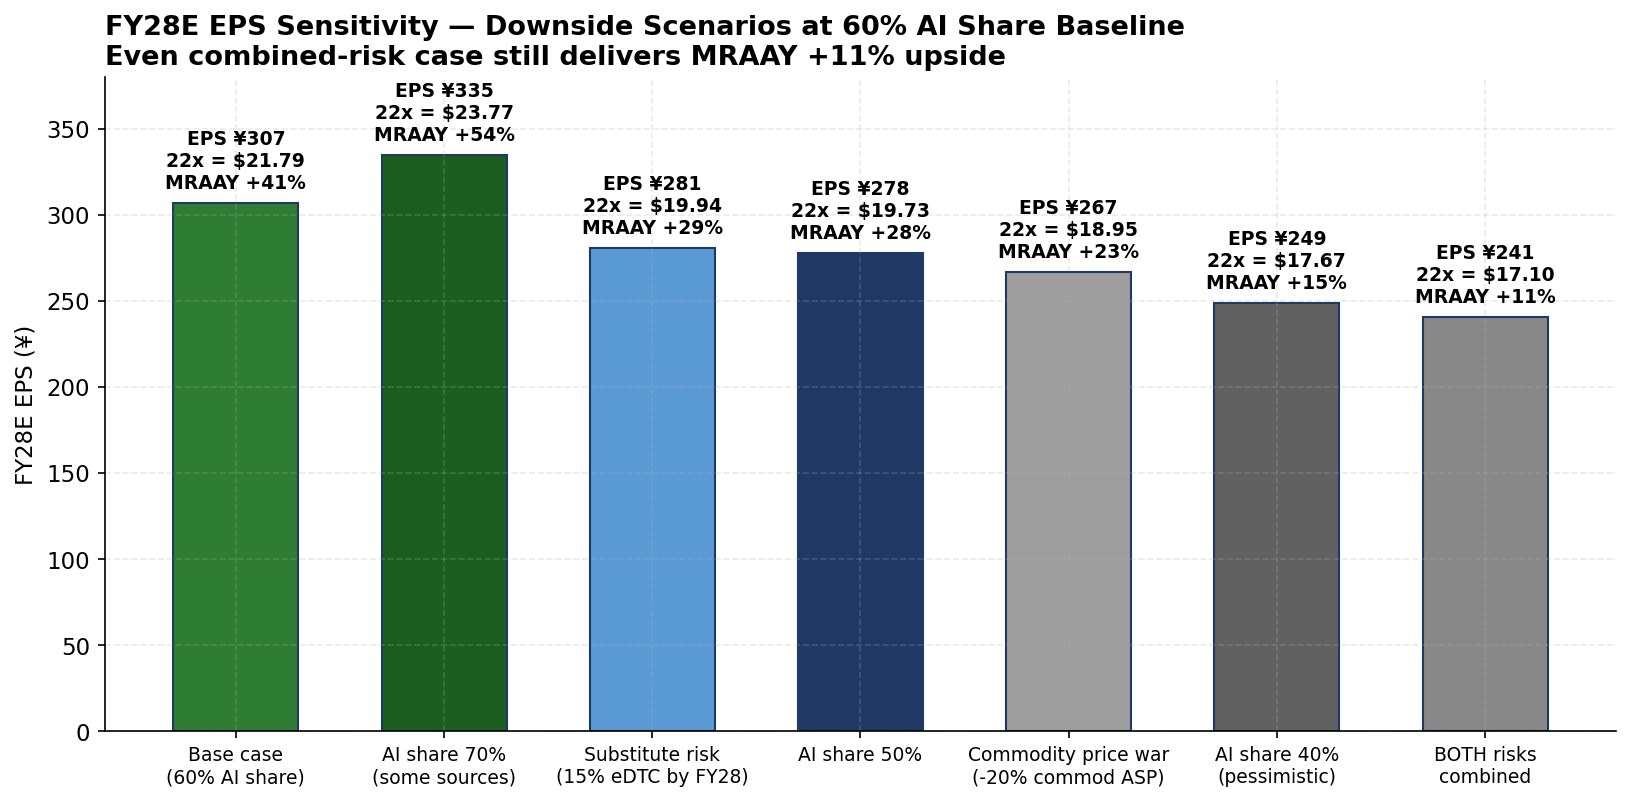
So here’s how the thesis breaks. We have explicitly modeled the largest non-cyclical risks below.
Risk 1: Substitutes (Silicon Capacitors, eDTC, HD-MiM, IVRs)
TSMC has been building silicon-based capacitor technology directly into its CoWoS advanced packaging for years. The relevant technologies are:
HD-MiM (high-density metal-insulator-metal): A capacitor placed in the silicon interposer between Metal1 and Metal2 layers. Capacitance density of roughly 17 fF/µm². TSMC introduced this at IEDM 2014.
eDTC / iCAP (embedded deep trench capacitor): TSMC’s vertical-trench capacitor technology, introduced at IEDM 2019. Capacitance density up to 340 nF/mm², roughly 20x higher than HD-MiM. TSMC’s own published research describes eDTC as a direct replacement for “MLCC LSCs and similar components.”
Integrated Voltage Regulators (IVRs): Power regulation moved onto the die itself. Intel’s FIVR shipped 11 years ago. TSMC is positioning IVR + eDTC as the path forward at a system level.
These technologies are already in production. TSMC eDTCs are in CoWoS packages today. They were used in Apple’s A10 (2016) for InFO packaging where they explicitly replaced MLCC land-side capacitors. They are being scaled into AI accelerator packaging now. TSMC’s own positioning at the 2025 NA Tech Symposium: eDTC + UHPMIM “can support 50% more power density” for next-gen AI accelerators.
The honest assessment:
The 441K MLCCs in a Blackwell rack split roughly into three tiers:
~30-40% are package-level decoupling close to the die. At highest risk of eDTC/HD-MiM displacement.
~40-50% are mid-distance bulk decap (the “land-side” MLCCs directly under the package). TSMC’s LSC technology already targets these.
~20-30% are board-level bulk caps that need physical capacitance for low-frequency response. Hardest to replace.
In a worst case, eDTC and adjacent technologies could displace 50-70% of MLCC content over time.
But the timing matters enormously. Blackwell is shipping now with MLCC-heavy designs. Rubin (R100/VR200, 2026-2027) is design-frozen. Murata’s content per box is locked through at least Rubin Ultra (2027-2028).
The substitution risk really lands for Feynman generation (2028+) and beyond.
Quantified downside: If eDTC and adjacent technologies displace 15% of Murata’s AI MLCC content per box by FY28E, FY28E EPS drops from ¥307 to ¥281. At 22x P/E, that’s MRAAY $19.92 (+29% upside). The thesis bends but does not break.
For substitution to actually break the thesis, displacement would need to exceed 30-40% inside the FY28E window, which would require Rubin Ultra and Feynman to use materially different power delivery architectures than Blackwell. Possible but not likely on this timeline given that designs are typically frozen 18-24 months before production.
Risk 2: Commodity Price War (Yageo, Walsin, Sunlord)
Important distinction: A price war can only happen in the commodity segment. AI-grade and high-end automotive MLCCs are physically different products that Yageo and Walsin cannot make at meaningful volume. They have not qualified for AI server use cases. Sunlord, Three-Circle, and Walsin are all 2-3 nodes behind on layer count and yield. They are aggressively investing but qualification timelines are years long.
The risk is that as Yageo/Walsin add commodity capacity into a softening commodity market, commodity ASPs come under pressure. Murata’s commodity revenue is roughly 19% of MLCC revenue and 11% of total revenue.
Quantified downside: A 20% commodity ASP decline (more severe than Banyan Lane’s base case of stable commodity pricing), with raw material costs (BaTiO3, palladium, nickel) staying flat in a true price war, costs Murata roughly ¥85B of FY28E gross profit. That takes FY28E EPS from ¥307 to ¥267. At 22x, that’s MRAAY $18.97 (+23% upside). The commodity segment can lose more than half its profitability and the AI thesis still works.
Risk 3: Both Risks Combined
What happens if BOTH substitute pressure AND commodity price war hit simultaneously? FY28E EPS drops from ¥307 to ¥241. At 22x, MRAAY target is $17.13, still +11% above current ($7 IRR over 18 months). Even in this combined-risk scenario, the trade still has positive expected return.
Risk 4: AI Capex Digestion in 2027-2028
This is the single biggest cyclical risk. Hyperscaler capex peaks in 2026-2027 and starts to digest in 2028. If digestion is sharper than modeled, AI MLCC volume growth flattens earlier. Mitigant: long-term agreements blunt the near-term, and the model doesn’t assume digestion until FY29+. Watch for hyperscaler 2027 capex guides starting in late 2026.
Risk 5: Murata’s AI Share Is Lower Than 60%
The single largest data risk. If Murata’s AI MLCC share is actually 50% rather than 60%, FY28E EPS drops from ¥307 to ¥278. At 22x, that’s MRAAY $19.72 (+28% upside). At 40% share (= overall MLCC share, very pessimistic), FY28E EPS drops to ¥249, implying MRAAY ~$17.68 at 22x (+15% upside). Even at 40% share the trade still works.
Risk 6: SEMCO Margin Compression Using Captive Samsung Foundry Relationships
A skeptic would argue that SEMCO could use cross-subsidization from Samsung Foundry to undercut Murata on AI-grade pricing. The current evidence runs the other way. SEMCO’s Q1 2026 results show them following Murata’s pricing playbook, not breaking it by pursuing long-term supply agreements with Big Tech, signaling 5-10% price hikes themselves, positioning the brand around premium AI MLCCs (”World’s Only AI Core Component Solutions Provider”). SEMCO’s MLCC operating margin is roughly 9-10%, lower than Murata’s 13-16%. They cannot afford to undercut without going into operating losses. Their incentive structure aligns with maintaining pricing discipline through this cycle.
If this changes (signs would be: SEMCO publicly announcing price cuts to win share, or aggressive price disclosures in customer LTAs), it’s a real thesis risk.
Other Meaningful Risks
Architectural shifts that reduce MLCC count per server. NVIDIA’s Rubin generation may use higher-voltage power delivery that needs fewer MLCCs per chip. Counts could drop 20-30%, but ASPs may more than offset.
Hyperscaler buying power. If Apple-2018 dynamics return and hyperscalers force prices down via long-term agreements, the ASP curve flattens. Counter: AI is a supplier’s market right now, not a buyer’s market.
Murata-specific execution risk. New plants ramping (Izumo started Apr 2026), capex digestion in their own P&L. Murata is operationally excellent historically, but execution is never zero-risk.
What Would Change The Thesis
Murata book-to-bill drops below 1.0 for two consecutive quarters (currently above 1.0)
Hyperscalers collectively guide flat-to-down 2027 capex in their late-2026 earnings
Chinese supplier qualifications accelerate and ByteDance/Alibaba publicly approve them for AI use
TSMC discloses substantial eDTC/HD-MiM adoption commitments from NVIDIA on Rubin Ultra or Feynman
SEMCO publicly announces price cuts to win AI share
Until any of these happens, the path is intact.
Part 12: Bottom Line
Murata Manufacturing makes a tiny ceramic component that AI servers need by the hundreds of thousands. Demand is exploding because of AI infrastructure buildout. Supply is structurally constrained because making the high-end versions requires technology only 3 to 4 companies in the world have, and adding capacity takes 24 to 30 months. As a result, prices are rising and margins are expanding, and Murata’s mix is shifting toward exactly these high-end products. By FY2028, Murata will earn meaningfully more than Wall Street expects (40% to 90% more in operating profit), generate $2.6B of free cash flow per year, and deserve a multiple closer to cycle peaks than cycle troughs. The base case implies MRAAY at $18-22, a 19-41% total return or 12-26%annualized IRR over 18 months. Bull cases get to $21-28 (24-48% IRR). Even under combined-risk scenarios, MRAAY upside stays positive.
This setup hits all three Banyan Lane axes:
Cyclical: Lead times stretching from 8 to 24+ weeks. Price hikes already announced and flowing through. Classic cyclical inflection.
Secular: AI infrastructure is a multi-year buildout creating a new product category (high-cap MLCCs for power delivery). For the first time in years of covering cyclical industries, there is a true structural demand driver.
Idiosyncratic: Murata’s ~60% share of AI-server-specific MLCCs vs. 40% overall, the cleanest US-listed exposure (MRAAY), the conservative guidance culture setting up beat-and-raise prints, an $8B net cash balance sheet supporting buybacks, and FCF inflecting from $0.6B to $2.6B in four years.
Catalysts to Watch
Near-term (next 2-4 quarters):
July 2026: Murata Q1 FY27 earnings, first full quarter showing April price hikes
August 2026: US hyperscaler Q2 earnings, read-through on AI capex pace
October 2026: Murata Q2, book-to-bill, AI mix, lead time updates
Late 2026: Hyperscaler 2027 capex guidance (the big one)
April 2027: Murata’s FY28 guidance, the moment of truth
Medium-term (12 to 24 months):
Second round of Murata price hikes (likely 2027 if shortage persists)
Chinese supplier qualification status
NVIDIA Rubin (VR200) and Rubin Ultra MLCC content disclosures
TSMC eDTC/HD-MiM adoption signals from NVIDIA/AMD
SEMCO Korean expansion ramp timing and pricing behavior
DISCLOSURE
Position: At the time of publication, the author owns Murata Manufacturing.
Trading Policy: The author will not materially alter this position within 48 hours of publication. After this period, the author may buy, sell, or otherwise adjust the position without further notice. Changes to the author’s view or position will be reflected in subsequent publications when material.
Conflicts: The author has received no compensation from the issuer or any party with a financial interest in this security.
Forward-Looking Statements: This report contains the author’s opinions, estimates, and projections, including price targets derived from financial models. These are forward-looking statements subject to substantial uncertainty. If these assumptions prove incorrect, the actual value may differ materially, including scenarios of significant loss or total impairment. The price target represents the author’s estimate of fair value under the stated assumptions, not a prediction of where the stock will trade.
This report is provided for informational purposes only and does not constitute investment advice. See the full Terms & Disclosures for additional important information.
Great article man, actually interesting which is rare
Subscribed, would love to have you along too🙂🙌