


The supply arriving in 2028 is public, countable, and lands inside a band a few points wide. The debate that actually decides the year is the shape of demand, and the buyers just raised their own numbers again. Below... the supply band defined, and then the demand drivers taken one at a time, each with the technology behind it, the companies building it, a probability, and a date.
The verdict, up front
Supply is close to a known quantity. Every project is announced and mapped. The entire 2028 supply band, from announced-only to a fully induced wave, is about 3 to 4 points wide, and the single biggest swing inside it is one company’s tool orders. Undersupply persists through 2028 on the announced path, the base-case 2028 gap is roughly minus 1 point, and 2029 re-tightens because the buildout outruns everything under construction.
Demand is the debate. Morgan Stanley raised its 2027-28 hyperscaler capex forecasts by 9% and 10%, to $1.2 and $1.4 trillion, and now models hyperscaler compute capacity growing roughly 4x from 2025 to 2028 (SemiAnalysis is ahead of even these figures). On top of that curve sits a stack of innovation vectors, each individually worth 2 to 10 points of the 2028 balance, each with a dated gate inside the next 18 months, and each with real companies shipping real products against it today. That stack, not the fabs, decides whether 2028 digests or re-tightens early.
One conditional governs everything. If AI capex enters a bear market, all bets are off, and the point to watch is spot prices cracking while contract prices hold, alongside widening credit spreads on datacenter debt. On the branch where spend keeps pace with expectations, buyers planning in multi-year cycles rationally pay for uninterrupted supply rather than haggle over one year’s balance, and the deposits flooding producer balance sheets say that is exactly what they are doing.
Price is doing all the work
Korea hosts roughly ~60% of world NAND capacity and publishes its exports monthly in both dollars and kilograms. Divide one by the other and the implied selling price is up three to four times year over year while physical volume sits flat. Volumes stay flat through the coming quarters by construction... no new fab delivers first bits inside 2026, and a wafer already started still needs about a quarter to finish. Every claim in this piece can be checked against that one free dataset, on the first of every month.
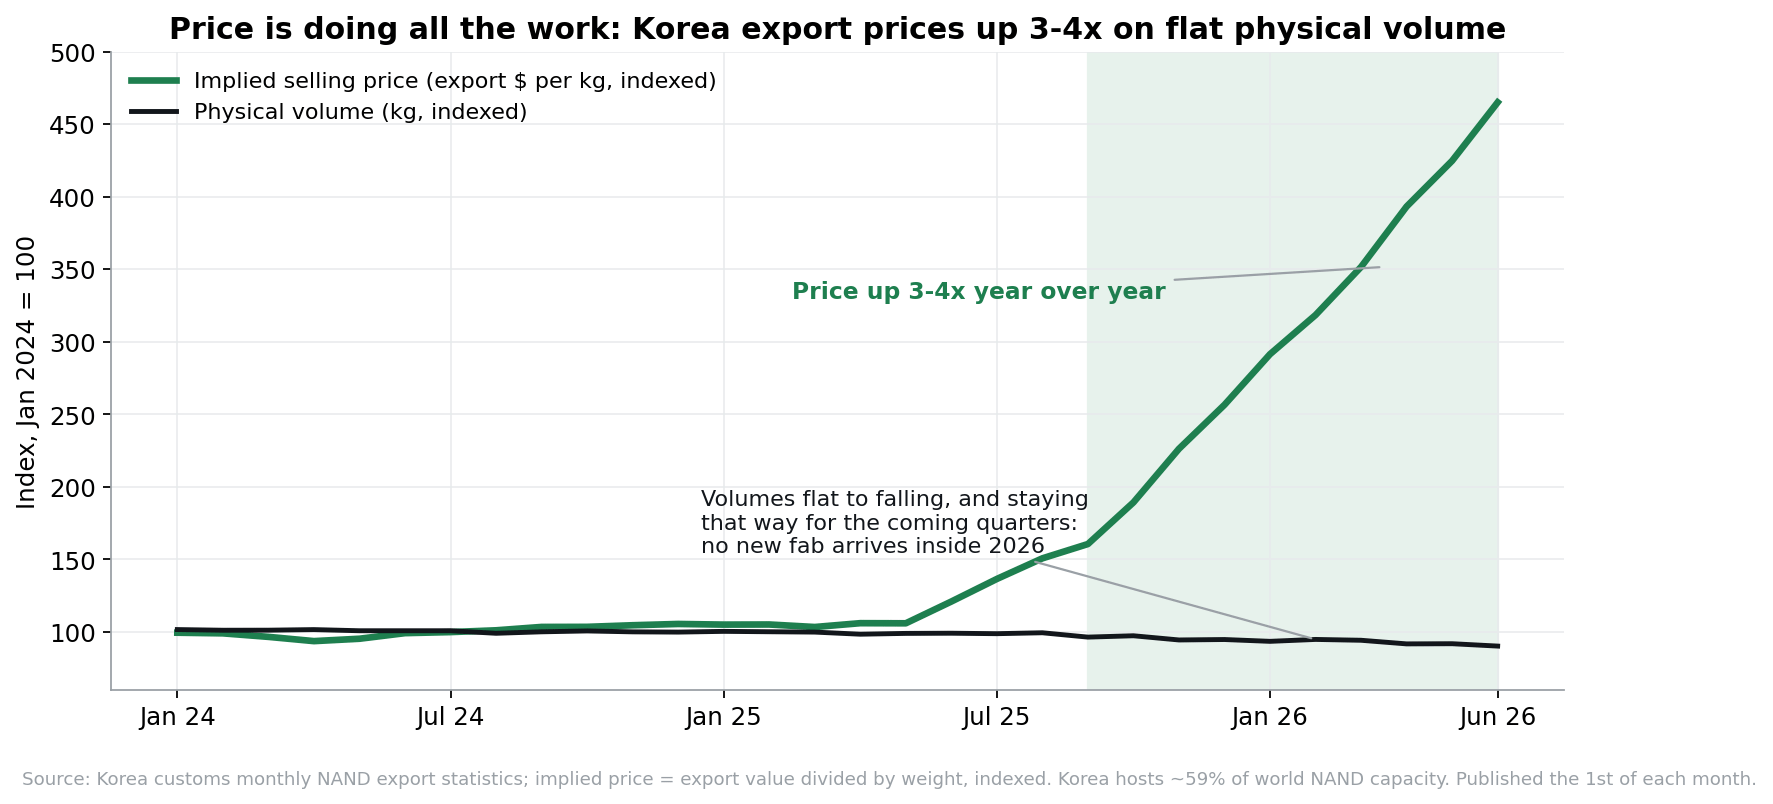
The tape behind that chart is worth spelling out, because the individual prints are hard to believe until you line them up. Korea’s NAND exports ran +366% year over year in January, +377% for the first quarter, and +207% in May... on falling kilograms. A one-terabit TLC chip that sold for $4.80 has printed $10.70. First-quarter contract prices settled up 33 to 100% depending on the product, and second-quarter settlements came in up another 70 to 75%. Counterpoint put first-quarter industry revenue at $46 billion, an annualized pace nearing $200 billion against roughly $74 billion for all of 2025. One honesty note belongs here because it applies to every forecast you will ever read on this market, including this one. The suppliers stopped disclosing absolute bit shipments years ago, so every exabyte model in existence, TrendForce’s, the sell side’s, and this one, is constructed by chaining disclosed growth rates off an anchor. The dollars and the kilograms are the only hard numbers in the whole debate, which is exactly why the Korea series is the referee.
Twelve years of deflation, inverted in one
NAND’s natural state is falling prices... cost per gigabyte drops 15 to 25 percent a year, bits compound, and buyers get rescued by physics on schedule. Twelve years of that pattern ended with the 2023 bust pricing bits at cash cost, roughly $0.055 per gigabyte, and producers answering with the deepest cuts in the industry’s history. AI demand arrived in late 2025 into a supply base that had been deliberately shrunk.
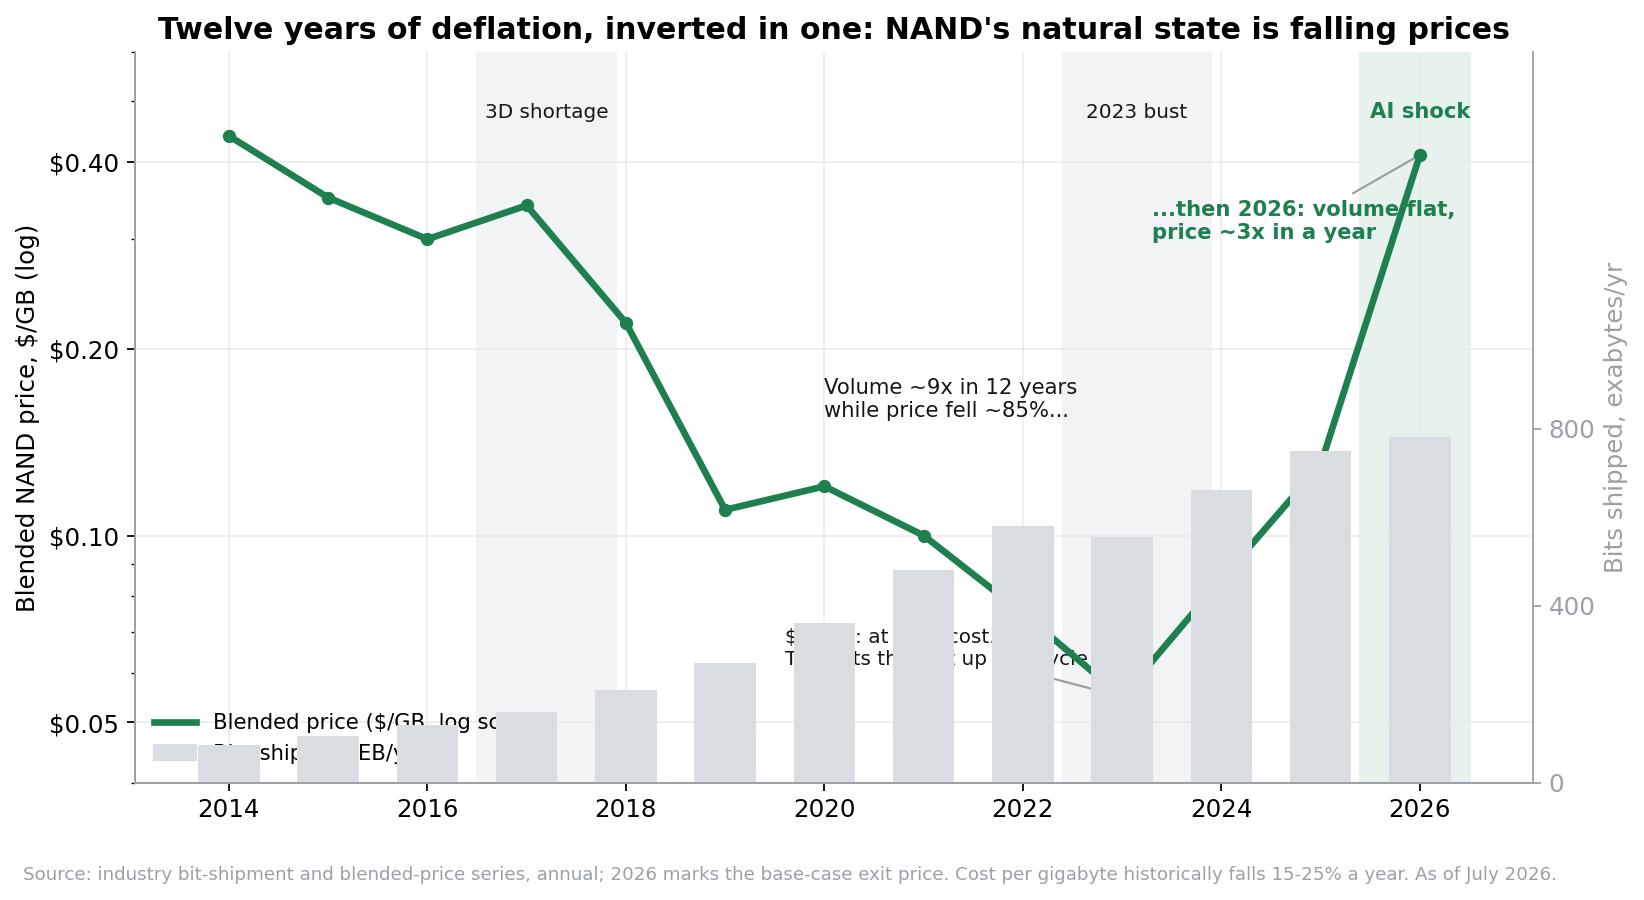
Walk the regimes and a base rate falls out. The 2016-18 supercycle was cloud demand landing on the 3D transition, and supply arrival cured it... prices fell roughly 60% in 2019, about two years after the price signal. The covid whipsaw pulled demand forward and then took it back. The 2022-23 collapse was the worst in the industry’s history, the first time bits ever traded at cash cost, and it did something no previous bust had done... it taught the survivors what the bottom actually looks like. Industry revenue went $57 billion in 2018, $39 billion in 2023, $74 billion in 2025, and the 2026 build now points to roughly $320 billion. Read that last jump carefully. Bits are up maybe 10% this year. The rest is price. Every prior shortage in this market was cured by supply within 18 to 30 months of the price signal, and that base rate is the strongest argument the bears have. The counterargument is physical. This time the cure is slower, because stacking toward 1,000-plus layers now requires bonding finished wafers together, every bonding step costs yield, and roughly a fifth of world capacity sits politically frozen at legacy nodes in China under export-control rules. The deflation that always rescued buyers is fading exactly as the biggest buyer the industry has ever seen walks in.
The buyers keep raising their own numbers
Plain and simple, buildout numbers keep going up... at least for now, though the revisions are smaller than early 2026 rounds. Morgan Stanley’s rebuilt bottom-up model puts hyperscaler compute capacity at about 30 gigawatts in 2025 growing to roughly 120 by 2028, four times in three years, and its 2027-28 capex forecasts moved up 9% and 10% in a single week, with Meta up 29% and 22% and Amazon up 15% and 29%. And look at what is driving the cost of a datacenter from $35 billion per gigawatt on GB200 racks to $39 billion on GB300 to $49 billion on Vera Rubin... partly memory inflation itself. Memory prices are now large enough to move the cost of the datacenter, which feeds the capex forecasts, which feed memory demand. Revisions this cycle have run one direction.
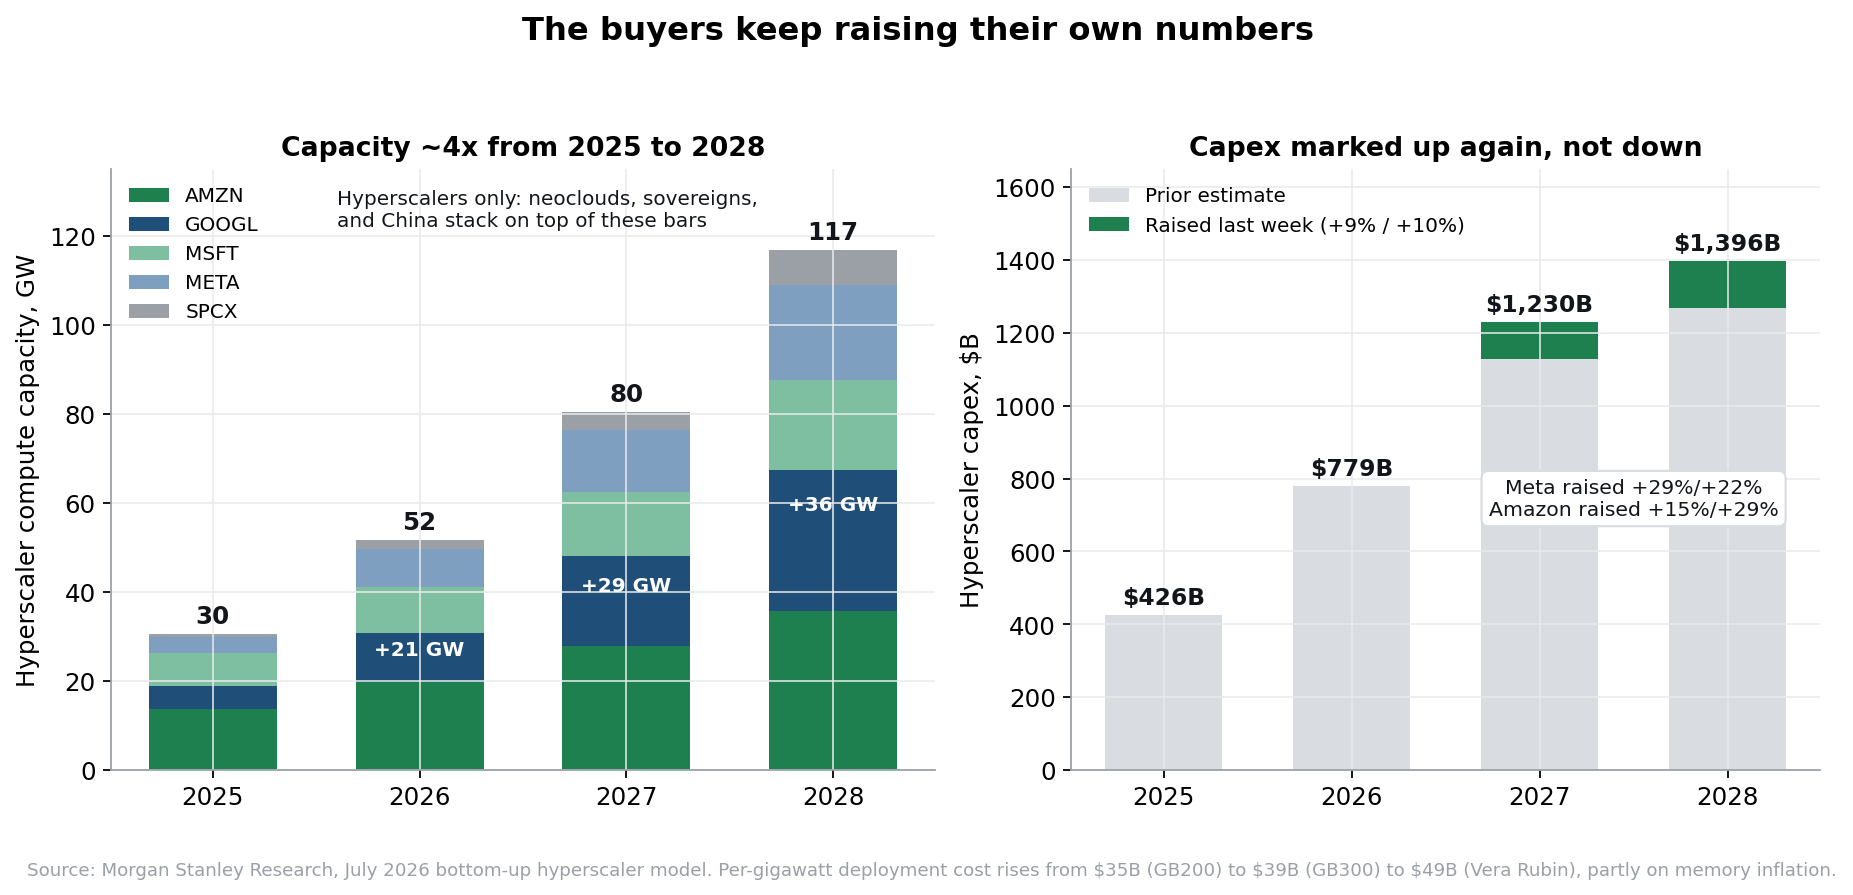
Those bars slot into the wider global picture. SemiAnalysis tracks global datacenter capacity outside China near 89 gigawatts in 2026, about 106 by 2027 on grid-connected supply, and as much as roughly 338 by 2030 once converted sites and behind-the-meter generation are counted. Inside that envelope, converting disclosed capex to capacity at $45-55 billion per gigawatt yields gross additions of 25-30 gigawatts in 2026 rising toward 70-77 by 2029, about 60-65 net of equipment refresh, and Morgan Stanley’s hyperscaler-only additions of 21, 29, and 36 gigawatts sit inside it as the floor. Each gross gigawatt carries 16 to 17 exabytes of NAND in the base case, and an independent rack-by-rack build lands within one percent of that arithmetic in every overlapping year.
AI is taking the market
AI is now the marginal buyer of every bit, and it is pushing phones and PCs down the queue. Handset makers are already cutting storage per device to absorb the price shock, resuming their traditional role as the market’s shock absorber, while enterprise and AI bits go from 22% of the market in 2024 to roughly 58% by 2030 in this build. Consumer becomes the residual claimant on wafers, which is why it absorbs the shocks in both directions.
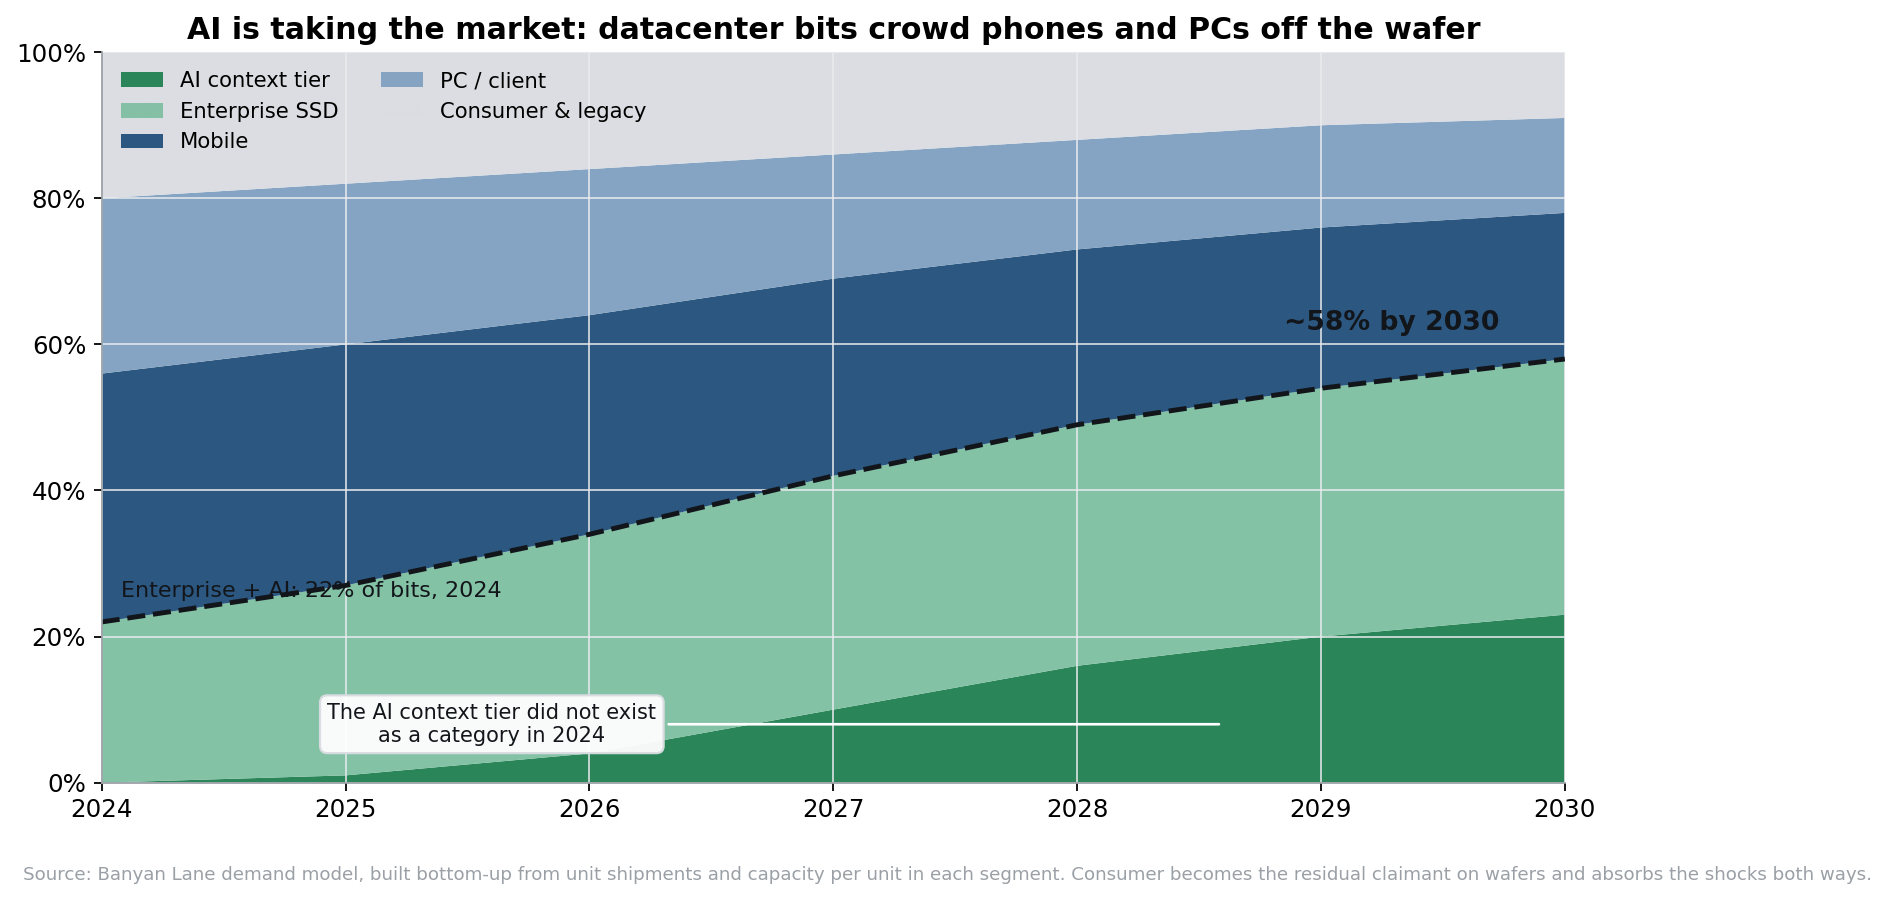
The engine behind that green wedge... when a model works a task, it holds a running memory of the session, the KV cache. The physics of it can be derived on one page. A model writes somewhere between 35 kilobytes of cache per token, for the most aggressively compressed architectures like DeepSeek’s, and 300-plus kilobytes for frontier dense models, which means a single million-token session occupies 35 to 300 gigabytes per conversation. That state used to live in scarce GPU memory and die with the session. Agents broke the arrangement, because an assistant working a multi-day task cannot afford amnesia, and the operators did the arithmetic. Parking the state on flash costs about ten cents a day, while recomputing it burns about two dollars of GPU time every single time, and takes minutes the user will not wait. A 70-billion-parameter Llama model writes about 326 kilobytes of cache per token, which means a terabyte of expensive DRAM holds roughly eight minutes of context before eviction begins and hit rates collapse. Manus, the agent startup Meta bought for $2 billion, calls cache hit rate the single most important metric in agentic AI, and agents generate on the order of 100 times the tokens of a human chat. Moonshot’s Mooncake has pooled these caches across DRAM and SSDs at thousands-of-nodes scale since 2024, with peer-reviewed serving gains of 59% to 498%. Nvidia industrialized the pattern in January... ICMS, a dedicated flash tier for each Rubin pod, sized in Nvidia’s own words at petabytes per pod, shipping with the BlueField-4 processor in the second half of this year.
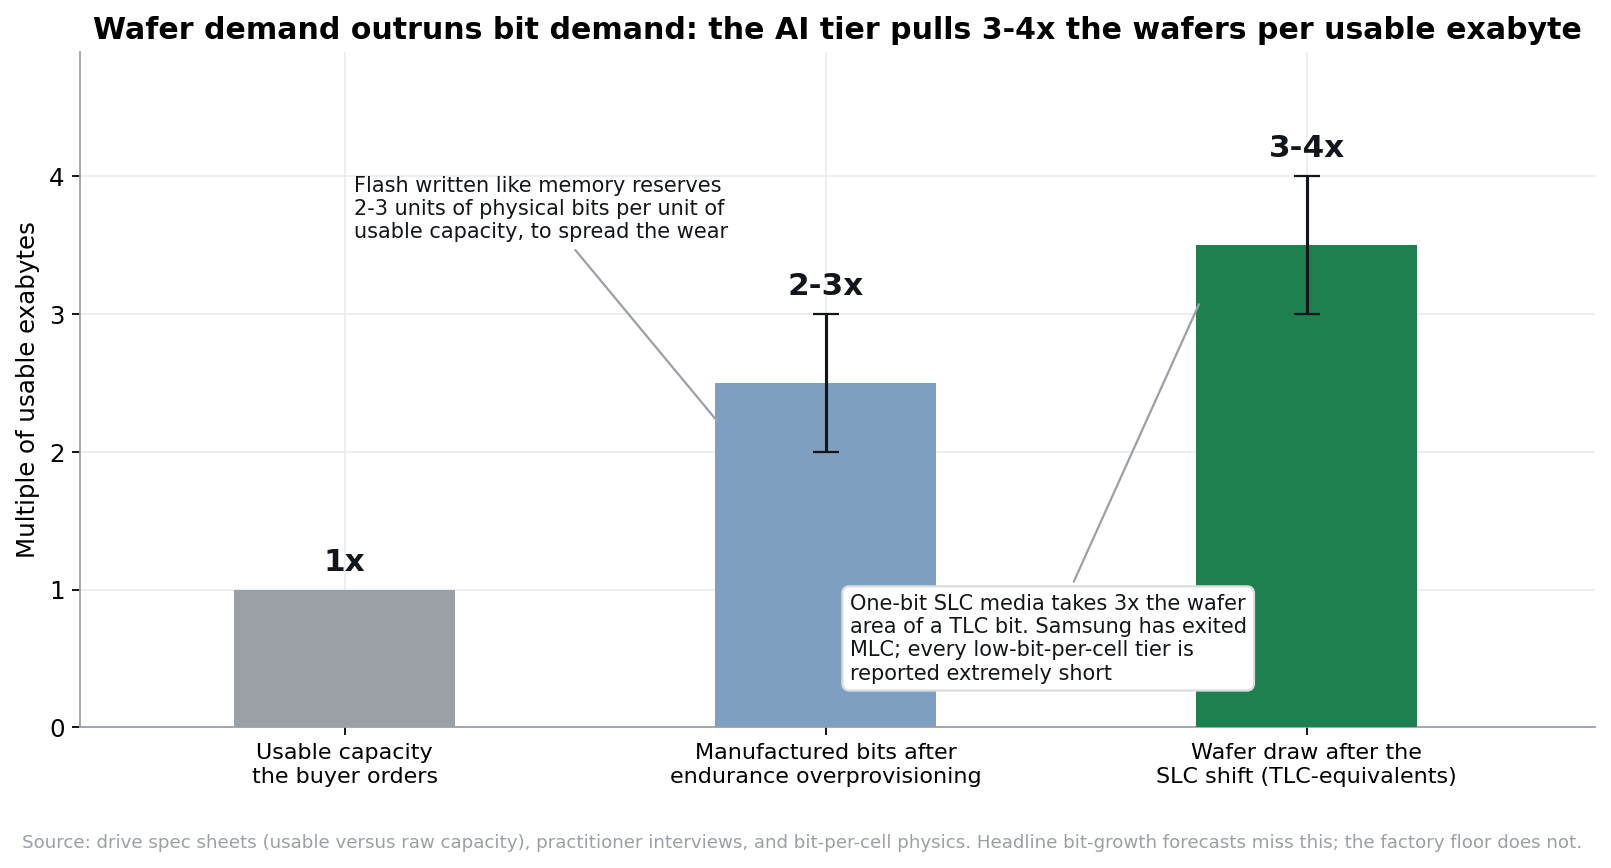
And the pull on wafers is bigger than the bits. A flash tier written like memory reserves 2 to 3 units of physical capacity per unit of usable capacity to spread the wear, and the AI tier is reviving one-bit-per-cell SLC media, which consumes three times the wafer area of a mainstream TLC bit. Samsung has exited MLC outright, and every low-bit-per-cell tier is reported extremely short. Stacked, the affected volume draws three to four times the wafers per usable exabyte, which is why wafer demand is rising faster than bit demand and why the shortage binds at the wafer, not the exabyte.
Supply... take it as given, inside a defined band
A handful of companies own effectively all the fabs, a greenfield takes 15 to 42 months from decision to first bits, and every project is announced and mapped below. That makes supply the knowable side of this market, and the honest way to treat it is as a given with a band. The band runs like this. 2026 is fully written, about 55,000 wafers per month of additions, 3.6 percent of the installed base, plus or minus a point. 2027 is plus or minus 2 points, set by K2’s ramp cadence and Dalian’s tool installs. 2028 is plus or minus 3 to 4 points, and Samsung is nearly the entire swing... V10 is slated for mass production in late 2026, yet as of May the tool orders had not been placed, and those purchase orders start a 15-to-21-month clock the whole market can read. 2029-30 widens to 8 to 10 points as M17, P5, Singapore, and YMTC’s next fab ramp or slip. Everything else is a 2029 story.
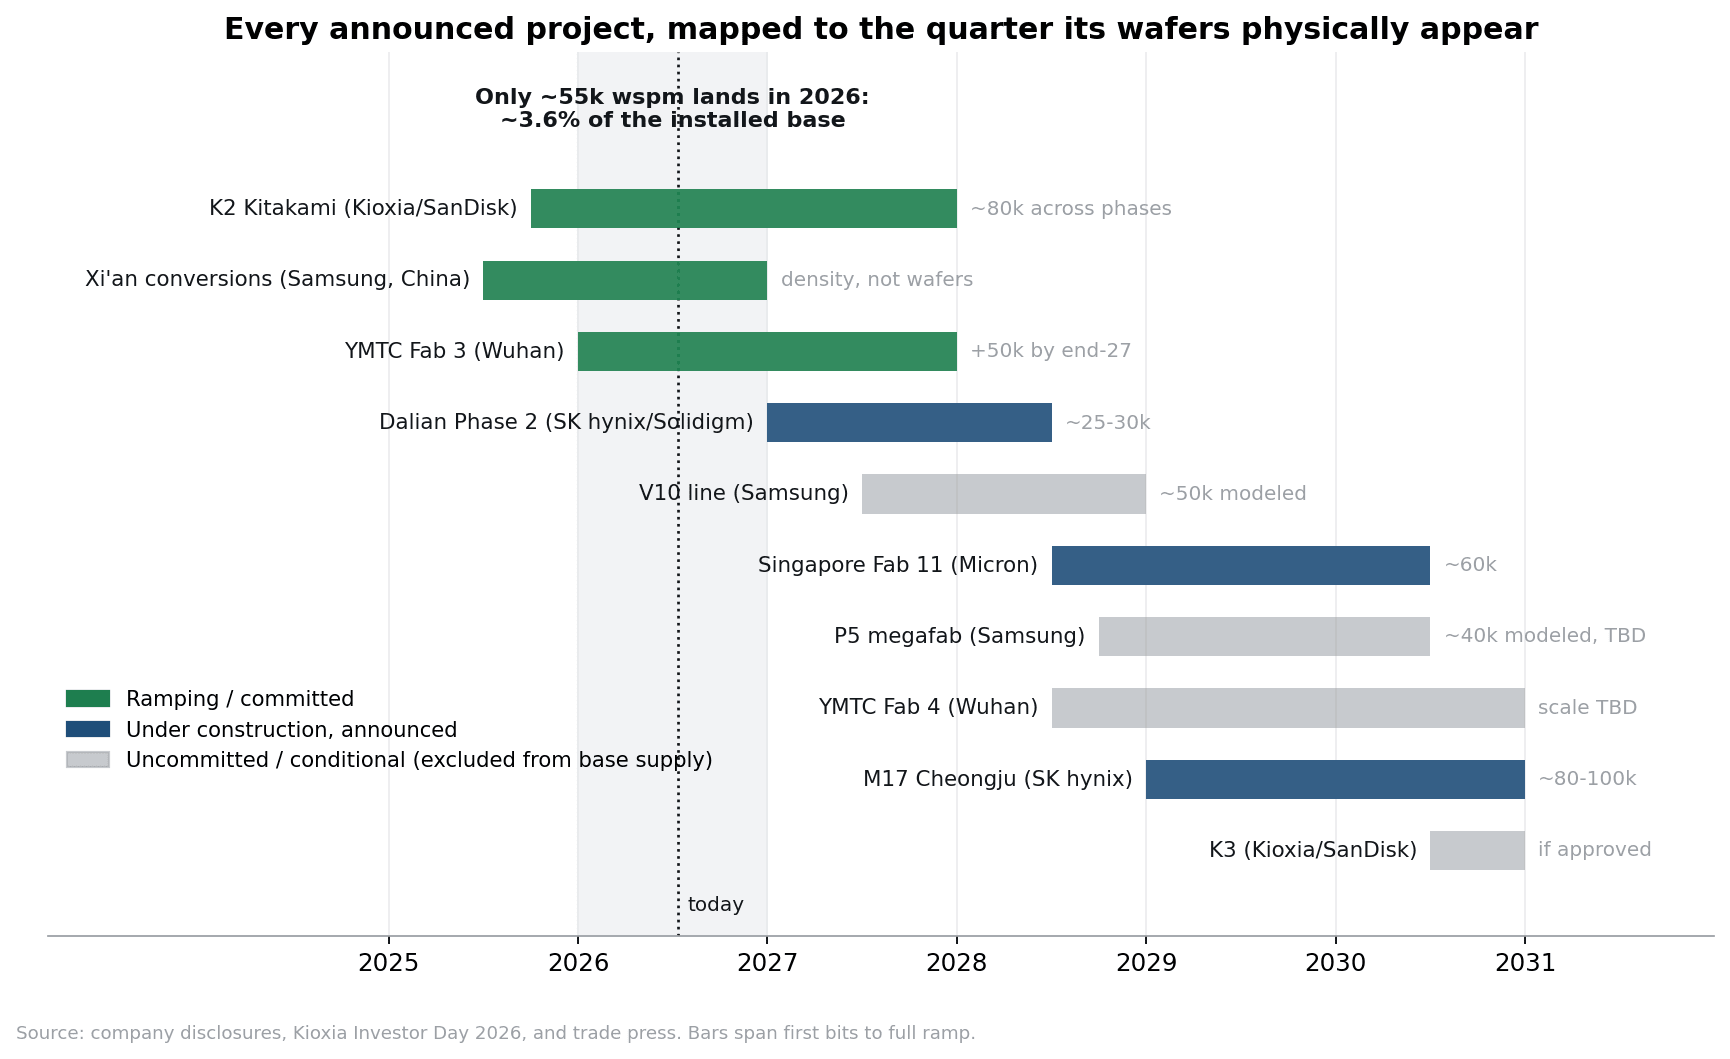
Why so much confidence in the band? Because the machinery only has so many levers, and the fast ones all point the wrong way. A wafer takes about three months and a thousand sequential steps to flow through a fab, so output physically cannot spike inside a quarter... that is the base clock under everything. Above it, the menu is short. Restoring idled utilization is the one fast lever that adds bits, and it is already spent... that is precisely what the flat Korea kilogram data means. Switching wafers into the AI-preferred one-bit mode is instant and subtracts two-thirds of their output. Node conversions are J-curves... output falls during the tool swap, then yield climbs from roughly 60% to 90% over a year. Greenfield is 30 to 42 months of concrete physics. And sitting on top of all of it is the most under-modeled friction in the industry... qualification. An enterprise drive must pass 6 to 12 months of hyperscaler validation per drive per platform, and a new node restarts much of it, so qualified supply structurally lags physical supply by two to four quarters. The net of all this is that supply arrives as datable lumps, the earliest observable event in the longest chain is a tool order, and that is why a single Samsung purchase-order headline carries more information than most quarters of earnings.
One paragraph of history explains why the band is credible rather than hopeful. This market earned its undisciplined reputation honestly... around 2003, roughly a dozen producers expanded into every uptick, and twenty years of losses did the consolidating, down to five groups plus one Chinese entrant, with the top two controlling about 58% of wafers. The 2023 bust finished the education. Now, against the strongest inducement any commodity has ever offered, a $15-20 billion fab paying back in under two years, the incumbents are still holding formation. The Kioxia/SanDisk joint venture funds growth entirely inside existing building shells, with either partner able to veto expansion and any new-fab decision pushed to fiscal 2027-28. Micron’s stated policy is no new NAND wafers beyond its Singapore project. SK hynix waited until this month to announce the cycle’s first true greenfield, and its first bits land in 2029, not 2028. The exception is state-funded YMTC, around 8 percent of wafers heading toward 17 by 2030, indifferent to price by design. Whether formation holds against a decade-long demand wave is a fair question. The tell is public, and it is Samsung’s order book.
The balance, and where the real debate lives
Cross the demand envelope against the two edges of the supply band...
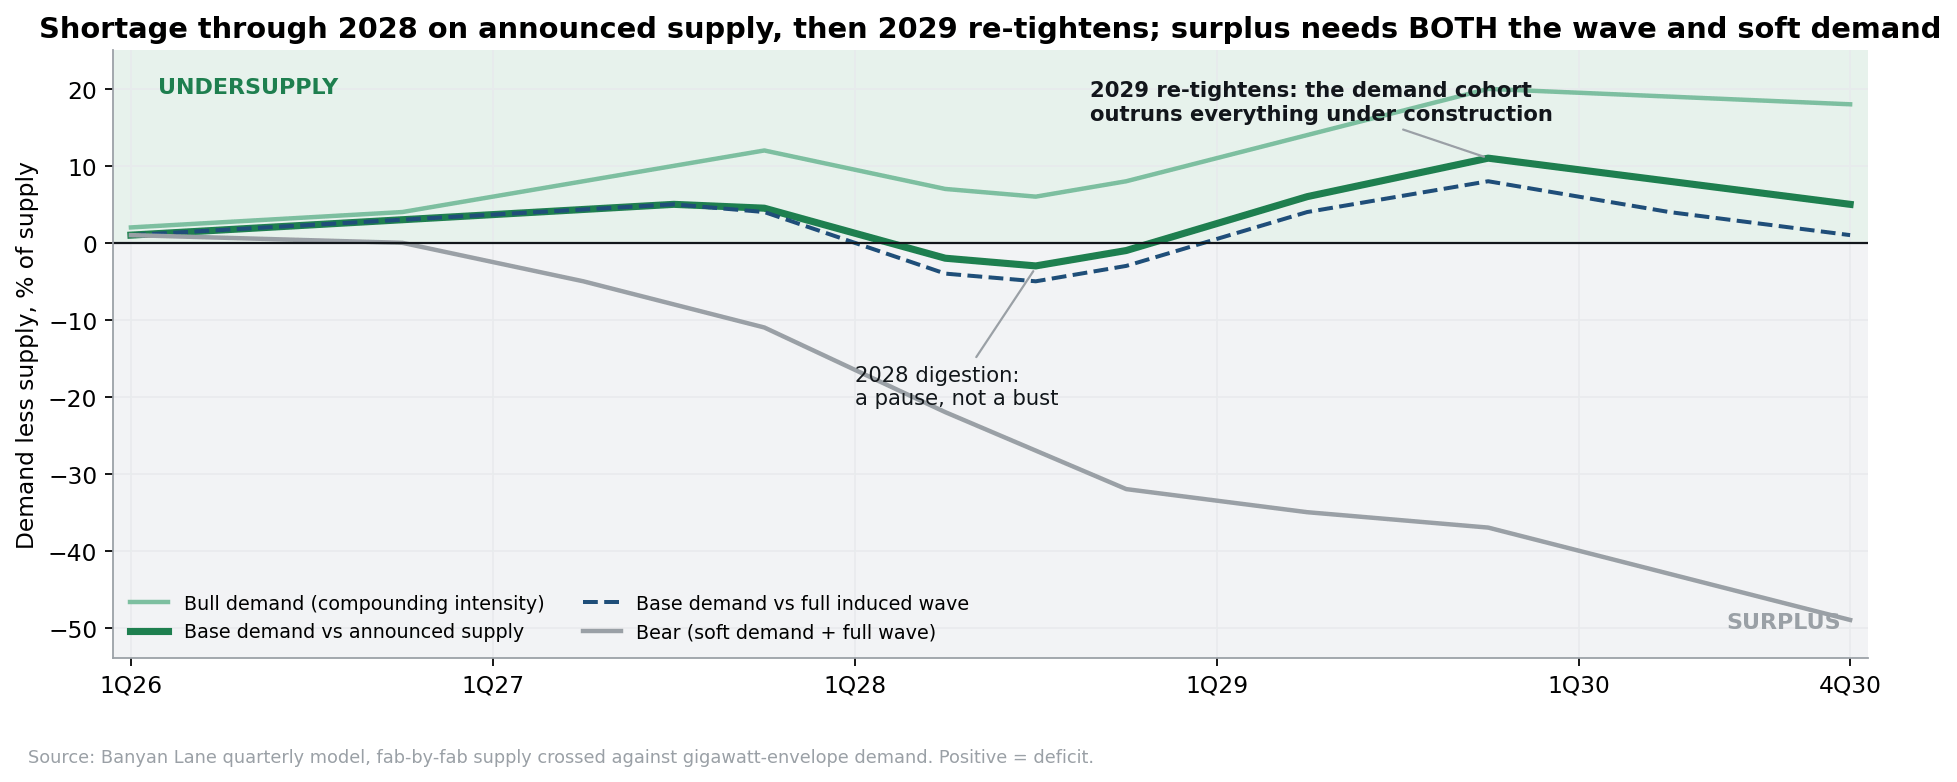
In 2028, the difference between announced-only supply and a fully induced wave is worth about 2 points. The difference between the demand paths is worth up to 9. Supply sets the stage... demand writes the year. That is why the rest of this piece is about demand.
2028... the demand drivers, one at a time
The fair way to handle a feared year is not to argue it away. It is to quantify what would deepen it and what would fill it, each variable alone, with a probability and a date. Do not sum the green bars... several are correlated (the attach dial and the SLC shift overlap in the same racks), and stacking them would manufacture a bull case. Read them as independent answers to one question. How much does this single variable move the 2028 balance if it goes its way?
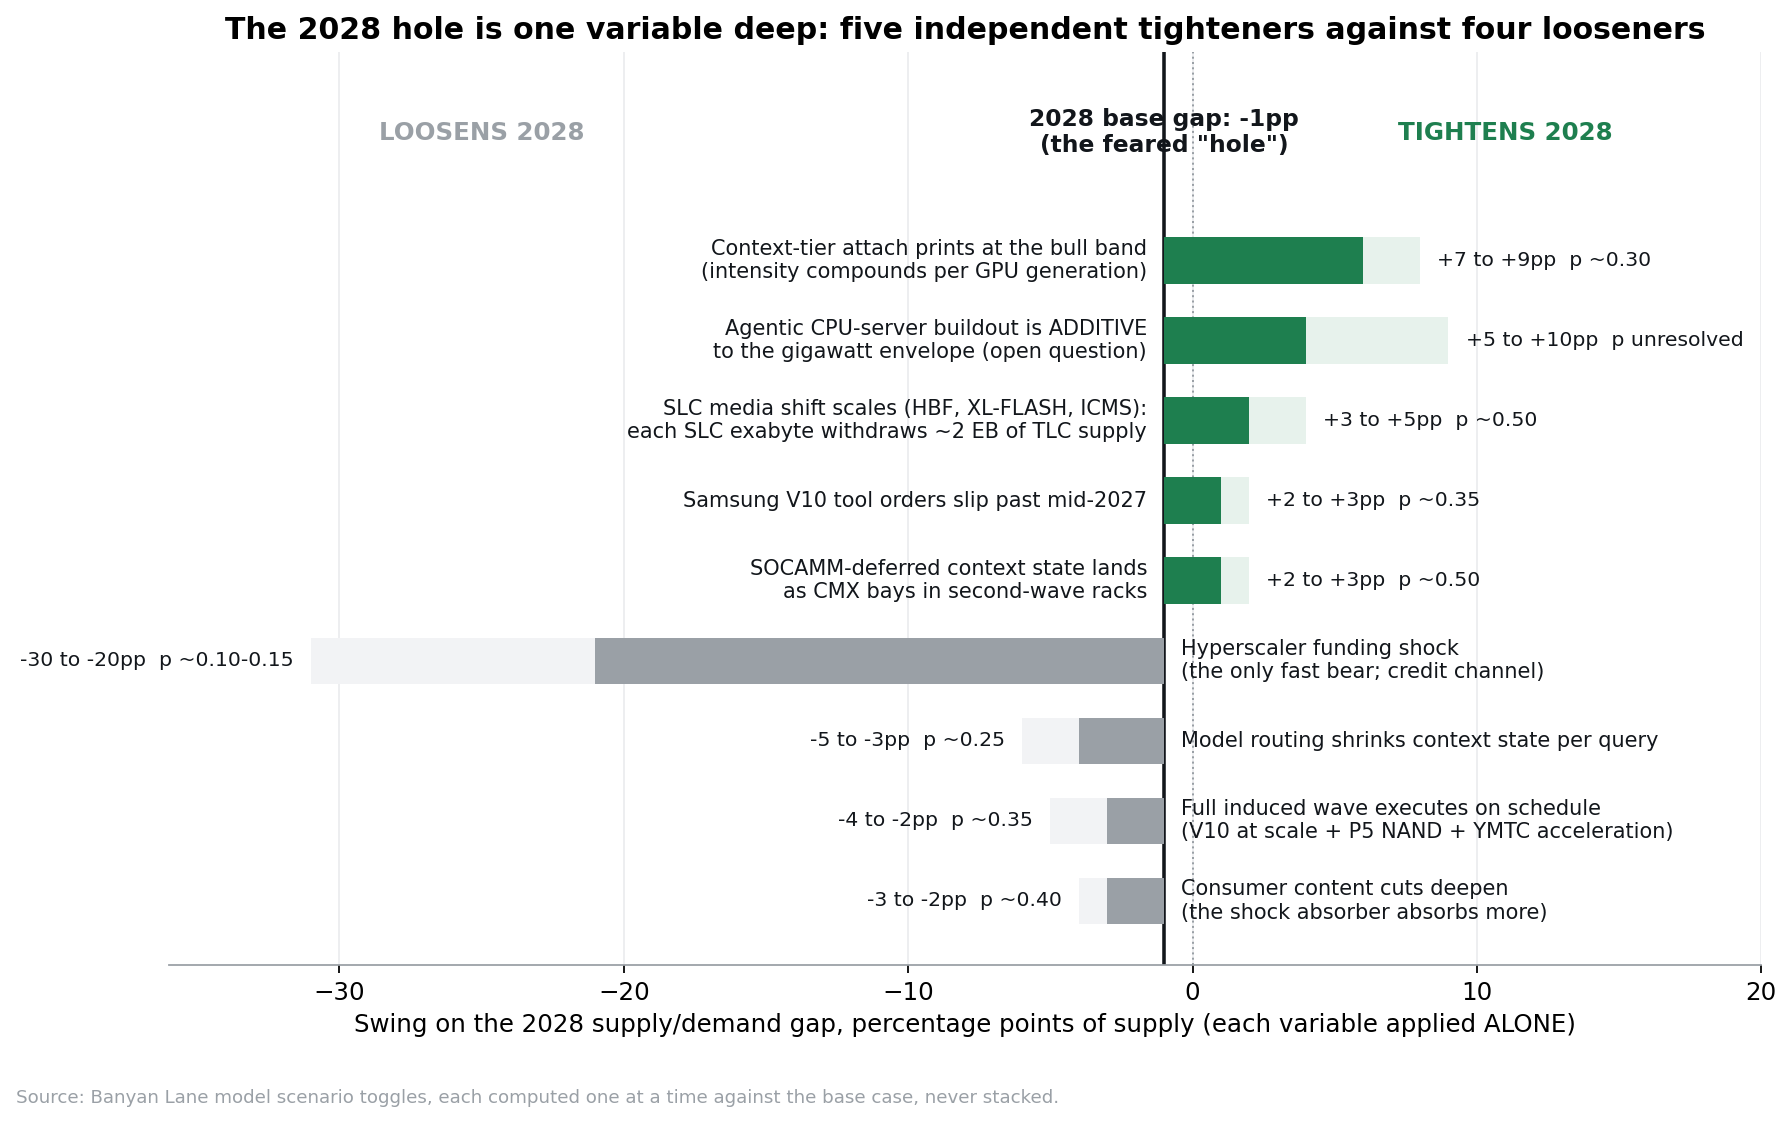
1. The intensity dial (+7 to +9 points, roughly a 30 percent chance). The base case holds storage per gigawatt flat, and every hardware precedent argues against that... HBM content grew roughly 50 percent per GPU generation, the newest racks carry four times the system memory of the prior ones, and cache-hit economics improve as storage is added, meaning flash converts directly into effective compute. The plumbing for this is shipping, not slideware. Nvidia’s Dynamo scheduler and its NIXL transfer library, riding GPUDirect Storage, let a GPU pull cache straight from flash with microsecond latency, and BlueField-4 fronts the whole tier. The storage industry has piled in behind it. WEKA’s Augmented Memory Grid, already generally available and validated with Supermicro, streams cache between GPU memory and what it calls a token warehouse at roughly 300 gigabytes a second per host, claiming a thousand times the cache capacity of DRAM and a twenty-fold cut in time-to-first-token on 128,000-token contexts. VAST Data open-sourced its equivalent, VUA, showing roughly threefold faster first tokens at 30,000-token contexts. Pliops sells a purpose-built accelerator card, an ASIC that turns a GPU server’s SSDs into a cache tier without touching the cluster architecture. Hammerspace, DDN, Lightbits, ScaleFlux, Peak:AIO, MinIO, Cloudian, and Graid all ship variants, and Quanta builds a server around the concept. If attach compounds the way memory content always has, 2028 swings from minus 1 to plus 8 on this dial alone. The range is measurable... the context tier spans 300 to 2,500 terabytes per rack depending on whose configuration wins, a spread worth roughly $200 billion of 2028 industry revenue, and it converts from assumption to measurement the day someone opens a shipping enclosure with a screwdriver, likely in the first quarter of 2027.
2. The memory transition (+3 to +5 points, roughly even odds). The deeper story practitioners keep telling is flash entering the memory hierarchy itself, and it is a wafer story, not a bit story. High Bandwidth Flash is SanDisk’s invention... sixteen flash dies stacked into a 512-gigabyte device delivering 1.6 terabytes a second, in a footprint that drops into an HBM4 socket, holding about four times the capacity of the HBM it sits beside at comparable cost. SanDisk seated David Patterson, the Berkeley architect behind RISC and RAID, and veteran chip designer Raja Koduri on its technical advisory board to shepherd it, then signed SK hynix last August to co-develop the standard, a competitor-turned-partner arrangement the industry has not seen since the early HBM days. Samsung and Micron are reported to be running their own designs behind it. One rung down, Kioxia’s XL-FLASH answers Nvidia’s explicit specification for a high-IOPS AI drive... single-bit cells read in about five microseconds, an order of magnitude faster than ordinary flash, with samples due this year. Both products run on the same production lines as mainstream flash, so every wafer they win comes out of the common pool, and because single-bit media takes triple the area, each exabyte of this tier effectively withdraws about two more exabytes of ordinary supply. The tier does not need to be huge to matter... it needs to exist.
3. The CPU-server line (+5 to +10 points, genuinely unresolved). Agentic AI turns out to be CPU-hungry... the scaffolding around every model call, the tool calls, retrieval, sandboxing, and scheduling, runs on ordinary cores, whether Intel and AMD sockets or the hyperscalers’ own Graviton, Axion, and Cobalt chips. A JPMorgan and Gartner forecast circulating this spring put server CPU units at 68 million by 2028 versus 26 million in 2025... stress-tested against wafer supply and the more conservative sell-side numbers, the mechanism survives with the magnitude cut by a third, to roughly 44 million. The strongest confirmation on record came from AMD itself, guiding that its server CPU shipments will decline in late 2026 because memory cannot be procured. Every one of those servers carries enterprise flash. The open question, and it deserves to be stated as open rather than assumed... is this buildout already inside the gigawatt envelope, or additive to it? If additive, it is the largest single tightener on the board, and Mercury Research’s late-August unit print will start answering it.
4. SOCAMM returns as flash (+2 to +3 points, roughly even odds). When Nvidia cut the Vera Rubin memory configuration from 192 to 96 gigabytes per module, the displaced context state did not vanish... it moved down the hierarchy toward flash, and the module sockets ship installed and empty either way. Dell, HPE, Supermicro, and Quanta are productizing the flash bays now, and the first wave of buyers is on the record... CoreWeave, Crusoe, Lambda, Nebius, and Oracle Cloud among them. If the deferred state lands in those bays through 2027-28, it is incremental NAND demand that no percentage forecast contains.
5. Samsung slips (+2 to +3 points, maybe one chance in three) is the one supply-side row worth carrying... every quarter of V10 slippage past mid-2027 removes supply from a 2028 that consensus already books.
The looseners get equal weight. A hyperscaler funding shock (minus 20 to 30 points, perhaps a one-in-eight chance) is the only force fast enough to break the balance before the fabs do, and it announces itself... spot cracks while contracts hold, and credit spreads on datacenter debt widen. Model routing (minus 3 to 5 points) is the honest demand-side risk... cheap small models handling more queries could shrink state per query even as queries grow. The compression version of this fear was just answered the other way. DeepSeek’s latest model cut cache size roughly tenfold, and total flash-resident context rose as cache-hit pricing collapsed and usage exploded, the oldest pattern in technology economics. Routing remains open. The full supply wave (minus 2 to 4 points) is smaller than intuition suggests, because even a maximal wave mostly lands in 2029 and later. Deeper consumer cuts (minus 2 to 3 points) are the shock absorber absorbing more.
What the fork does to price
Here is where the volume debate becomes a dollars debate, and where the structure of this cycle diverges hardest from every prior one. While shortages persist, price rises, capped only by what the contracts allow. A correction is not a schedule... it is an event, and the event requires two things to happen together, tool orders that have not yet been placed, and a demand undershoot that the buyers’ own raised forecasts argue against. In the base case, blended pricing grinds to roughly five times late-2025 levels by the end of 2027, gives back about 15% through the 2028 digestion, and firms again into 2029. The revenue arithmetic under that path runs from a peak near $314 billion in 2027 to a trough around $215 billion in 2028 and back to roughly $298 billion by 2030. The bull path, where content compounds and the correction never gets room to happen, grinds toward $936 billion by 2030... which, for calibration, is roughly the world the most evangelical price targets in this sector quietly require. The bear needs everything at once, soft demand and a full supply race and bending floors, and even then it produces $82 billion in 2028, a one-year drawdown harsher than the entire 2023 crash.
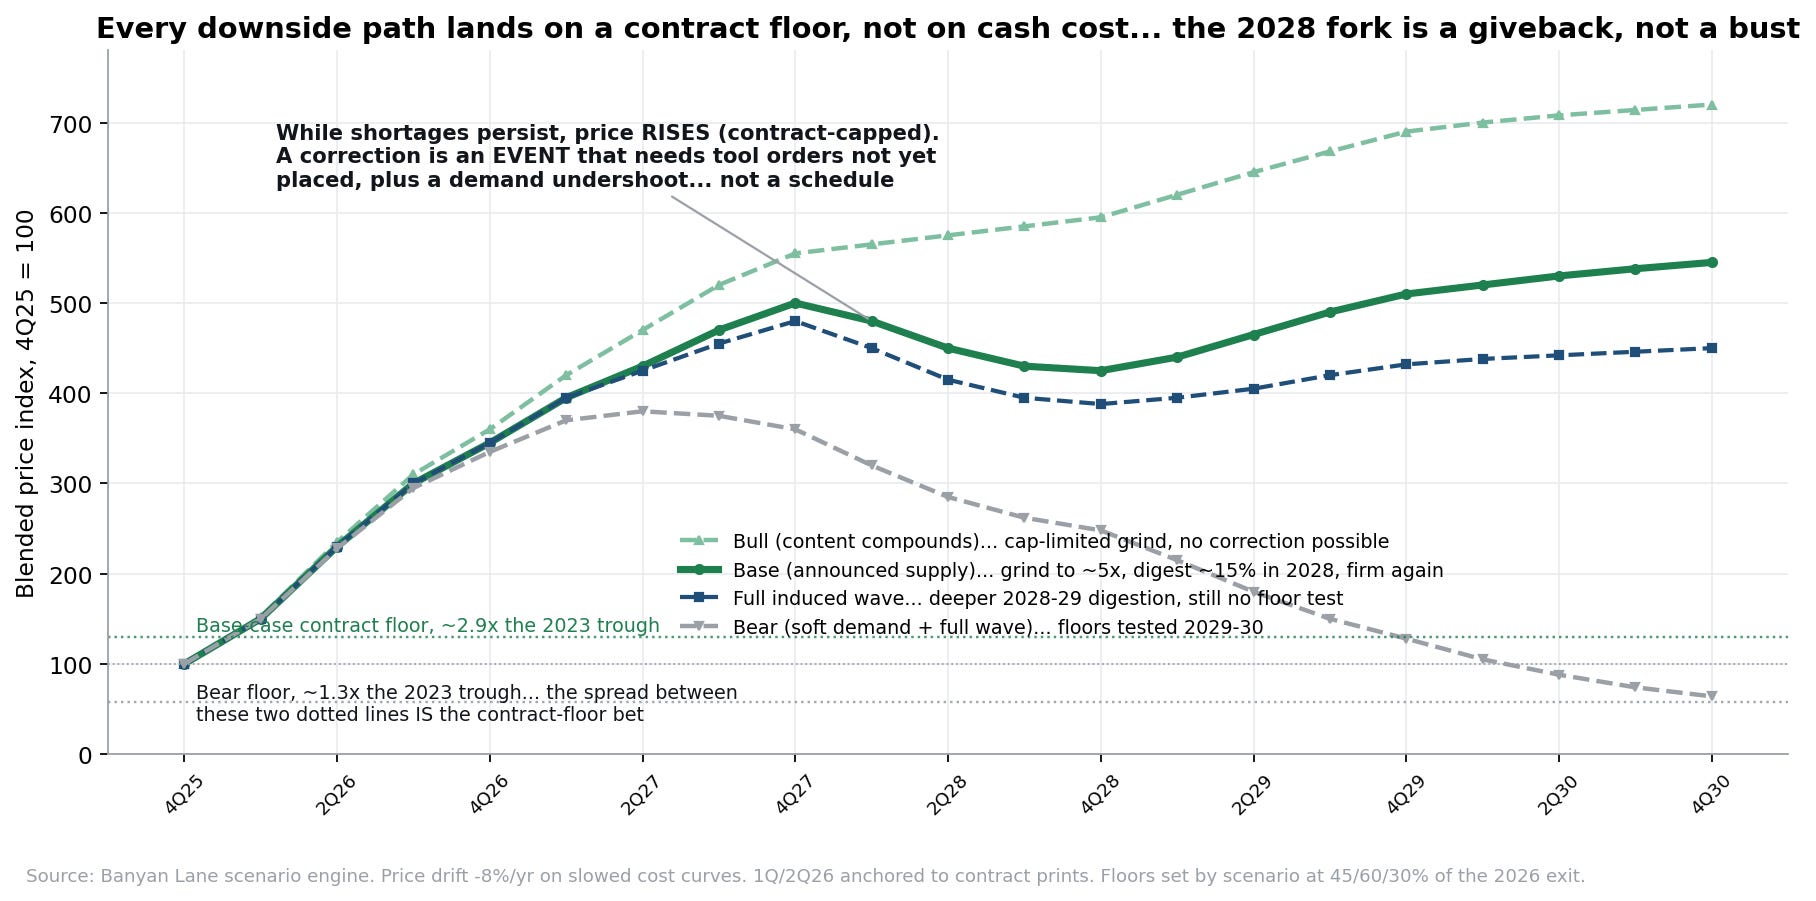
Two things on that chart deserve a hard stare. First, 2026 and 2027 barely fork at all. Those years are locked by allocation and contracts, which means the entire investment debate compresses into 2028 and beyond... trade the fork, not the consensus. Second, look at where the downside paths land. Every scenario keeps 2028-30 pricing above the 2023 trough of $0.055 per gigabyte. The base-case floor sits near $0.159, about 2.9 times the trough. The bear floor sits near $0.070, about 1.3 times. That spread, 1.3x versus 2.9x trough, is the single most valuable unknown in the entire model, and it is not a demand question or a supply question. It is a contract question, which is where this piece goes next... after one more stop on the demand side.
The upside has a calendar, and a cap table
What separates this demand stack from a story is that every vector carries a dated gate, a moment when it converts from assumption to measurement, and the whole calendar fits inside 18 months. Two more vectors sit beyond the tornado. Per-user persistent memory is quietly becoming its own funded software category... Mem0, which raised $24 million and became the memory provider inside Amazon’s agent toolkit, processed 186 million memory API calls in a single quarter. Letta grew out of Berkeley’s MemGPT research and pages an agent’s memory between context and disk the way an operating system pages RAM. Zep builds timestamped knowledge graphs so an agent knows what was true and when. Microsoft now ships user-scoped memory inside Azure AI Foundry and Oracle built a memory core into its database. Every fact those layers retain is a write that outlives the session, multiplied by user counts in the hundreds of millions. This is the vector where big and sudden is most likely and least priced, because it changes the demand equation’s very units... inference storage stops being per-query and becomes recurring per-user. Storage turning into a subscription. And behind that sit the video and world-model labs, World Labs, Runway, Luma, Decart, Odyssey, whose persistent interactive worlds hold state that makes text look small... that vector mostly loads 2029 rather than 2028.
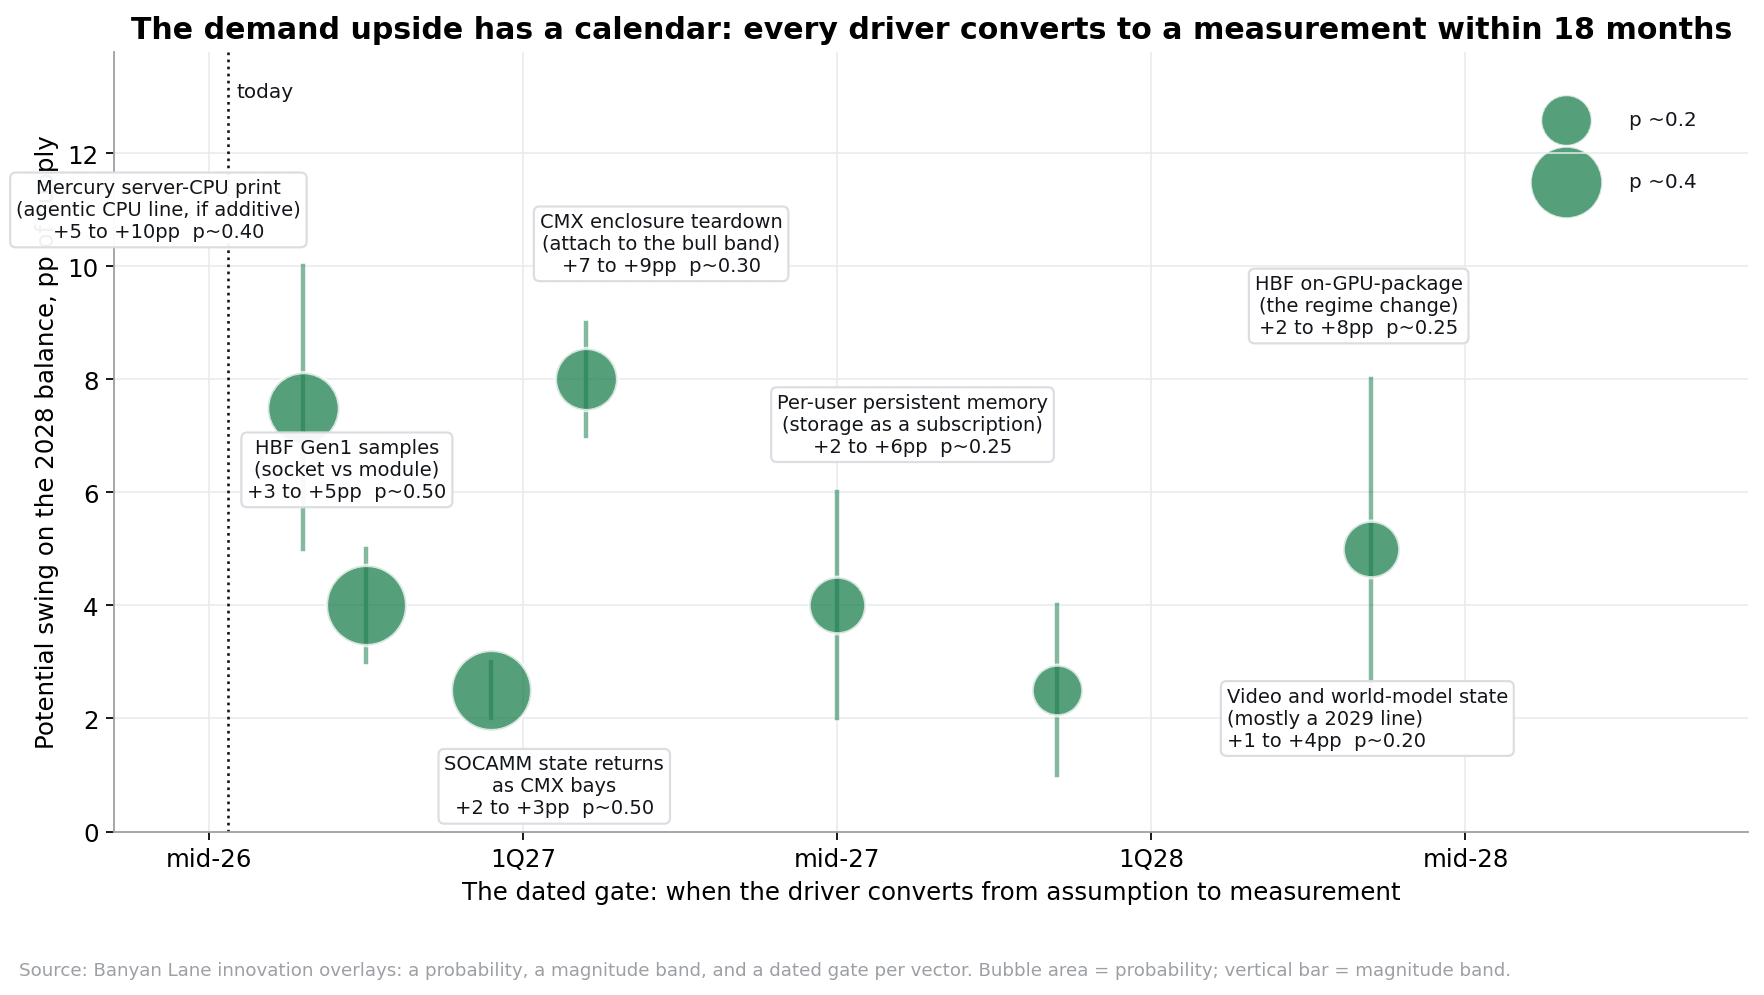
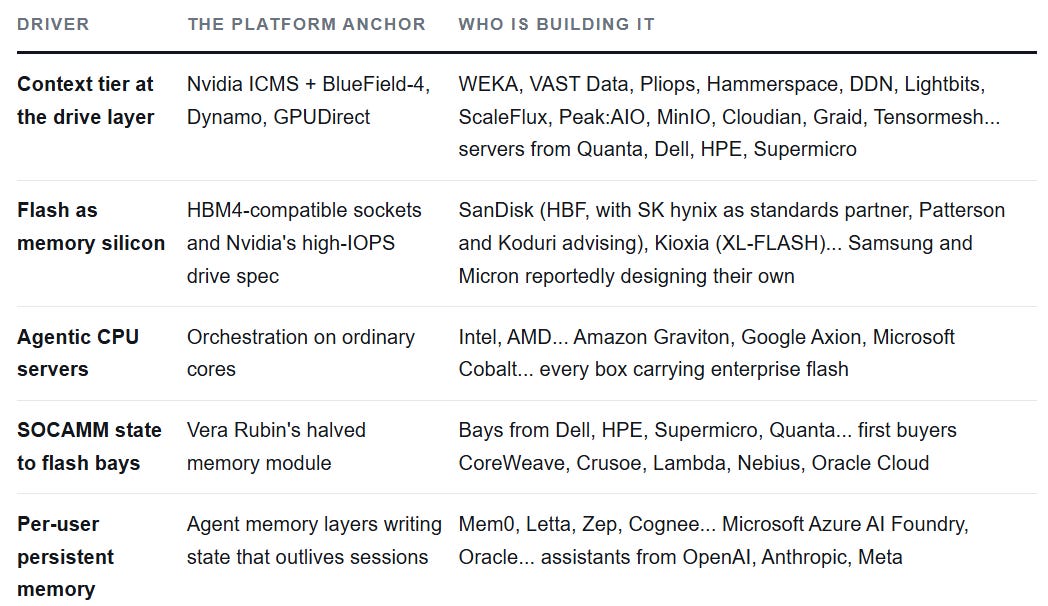
The market is pricing 2028 as if the supply is certain and the innovation is hypothetical. The project list says the supply is conditional. The shipping products say the innovation is not.
Look at 2028 from the buyer’s chair
The whole thesis folds into one conditional. If AI capex enters a bear market, all bets are off... the balance breaks through the credit channel faster than any fab can move, and no line on any chart above survives the repricing. That is the honest boundary of this analysis, and the tripwire never changes... spot cracking while contracts hold, credit spreads on datacenter debt widening.
Now walk the other branch, the one Morgan Stanley just marked higher. A hyperscaler planning a multi-year buildout is not studying 2028 balance charts hunting for a year to nitpick price. Memory inside a $49 billion gigawatt is a real cost but a survivable one. A gigawatt of racks sitting idle for want of drives is not. When a single teardown can swing the balance eight points, the rational buyer pays for certainty of supply and treats price as the second-order term. If anything, the move on this branch is to keep signing long-term agreements with flexible terms, locking volume while capping the downside, which is what the producers report the buyers keep asking for... Kioxia’s counterparties are already pushing to extend beyond 2029.
And notice what the buyers are actually doing, because it is stranger than it sounds. The largest, best-informed technology companies on earth are walking into commodity memory suppliers and offering to fund their capital spending, posting billions in cash as security. These are the operators of the biggest AI clusters in existence... nobody sees the next three years of compute demand more clearly than they do. The agreements are untested, and the first soft quarter will test them. But a deposit is a forward view expressed in cash, and the deposits are accelerating.
The floor under 2028 is written in contract law
Here is what that behavior has produced on paper, and it is the genuinely new feature of the cycle... for the first time in memory’s history, the buyers have posted cash. Micron holds 16 strategic customer agreements, five-year take-or-pay, covering roughly a third of its NAND volume, with about $100 billion of cumulative minimum revenue and roughly $22 billion in deposits and letters of credit. SanDisk’s order book runs to about $69 billion, backed by more than $11 billion of enforceable guarantees, across five multi-year agreements covering more than a third of next fiscal year’s output. Kioxia is targeting agreements over roughly half of its 2028 bits, with counterparties asking to extend beyond 2029. If a customer walks, the supplier does not sue for years... it draws on money that already exists.
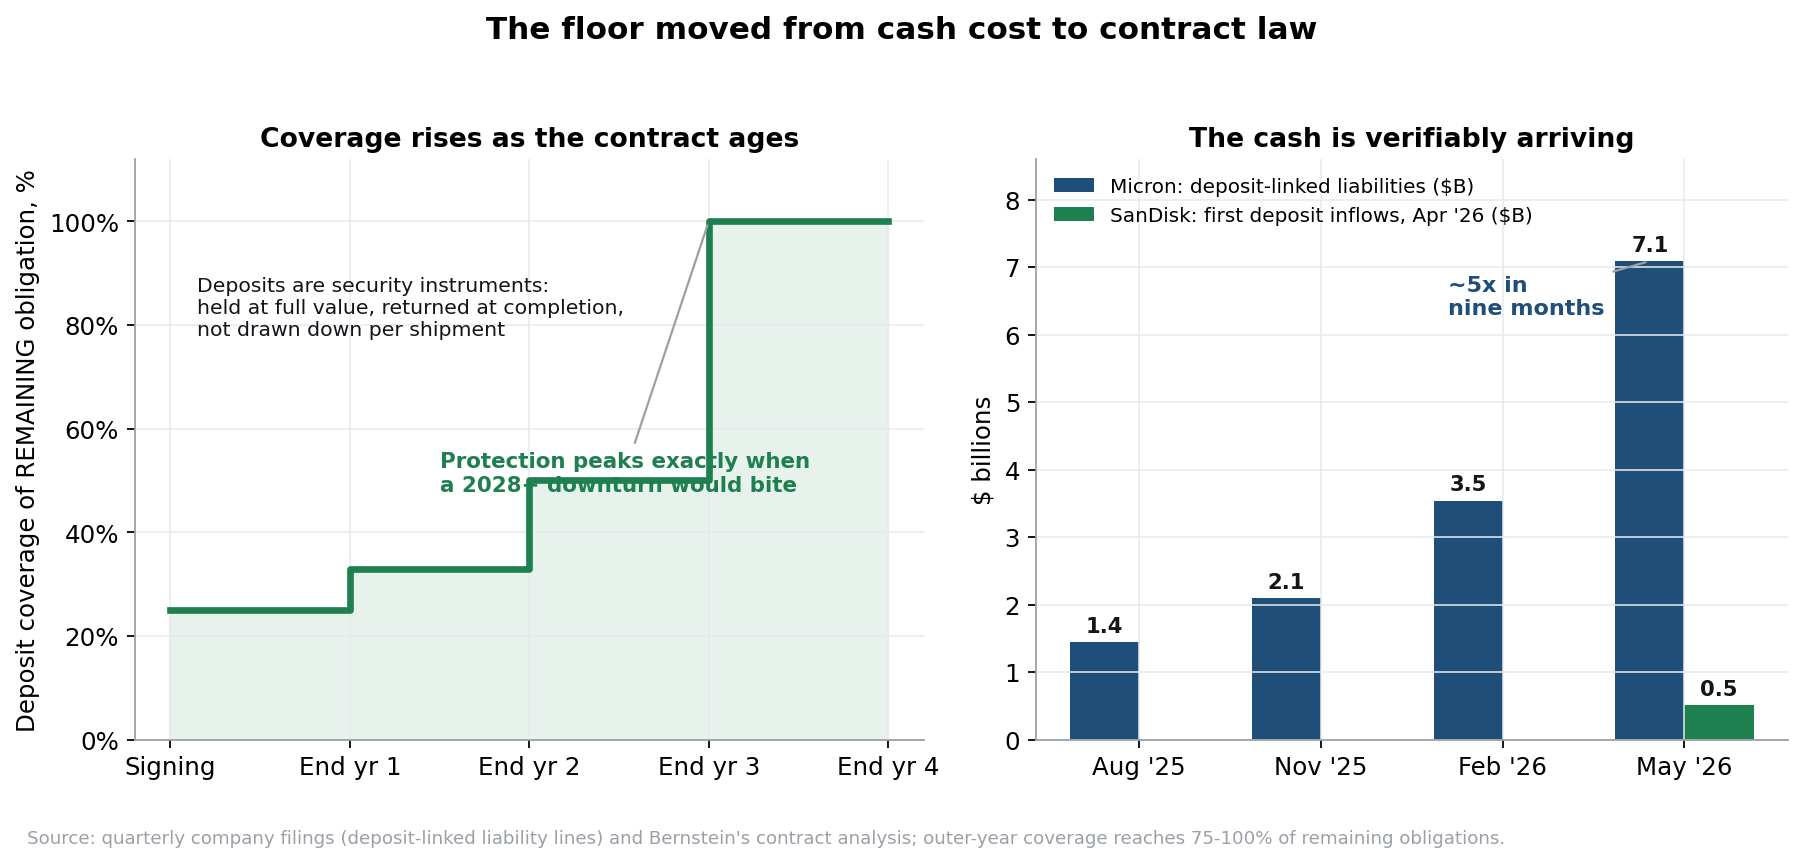
The deposit design matters more than the headline sums. These are security instruments, held at full value and returned at contract completion rather than drawn down per shipment, so the guarantee’s coverage of what remains owed rises over the contract’s life, from roughly a quarter at signing toward full coverage in the final year. Maximum protection lands exactly where breach risk lives... 2028 and beyond. The collection pace is sitting in the filings, with Micron’s deposit-linked liabilities running from $1.4 billion to $7.1 billion in nine months and SanDisk booking its first $511 million of inflows in April. Customer floors typically sit 10-20% below baseline pricing, which is why the base case’s 2028 digestion prices as roughly a 15% giveback rather than a collapse, why consumer prices crack first while the contracted datacenter tier holds longest, and why the only fast bear runs through the credit channel. Fair warning on the limits... the fixed-versus-floating split inside each contract is largely undisclosed, the floors’ first real test only comes in the first soft quarter, and the same deposits come due for return around 2029-30, a refund cliff timed, by construction, to the arrival of the supply wave. Whether the floors hold on first contact is worth a factor of two on every terminal value in the sector... it is the 1.3x-versus-2.9x-trough spread from the price chart, restated in legal terms.
The balanced close
None of the upside is a promise. Any vector can fail cheaply... a teardown under 400 terabytes per rack halves the biggest demand line, a weak Mercury Research print in late August retires the CPU-server story, HBF sampling as a clever drive rather than a socketed device shrinks the memory-transition prize, and soft demand meeting full supply execution produces a 2028 surplus north of 30 points. But the shape of the debate is now clear. Supply is a band a few points wide with one company holding the pen. Demand is a freshly raised capex curve with an innovation stack on top, and if models keep improving, adoption keeps widening, and use cases keep multiplying, hardware innovation does not stop at the GPU and the CPU... it moves down the memory hierarchy toward wherever state can be held cheaply, because state is what agents accumulate. On the balanced reading, buyers take 2028 as a breather, give back perhaps 15 percent on price against contract floors, and walk into a 2029 demand cohort that nothing currently under construction can meet. The customers with the clearest three-year view are choosing to prepay for supply rather than wait for a better price. Their behavior is a forecast, and it is the one worth weighting.
The scoreboard
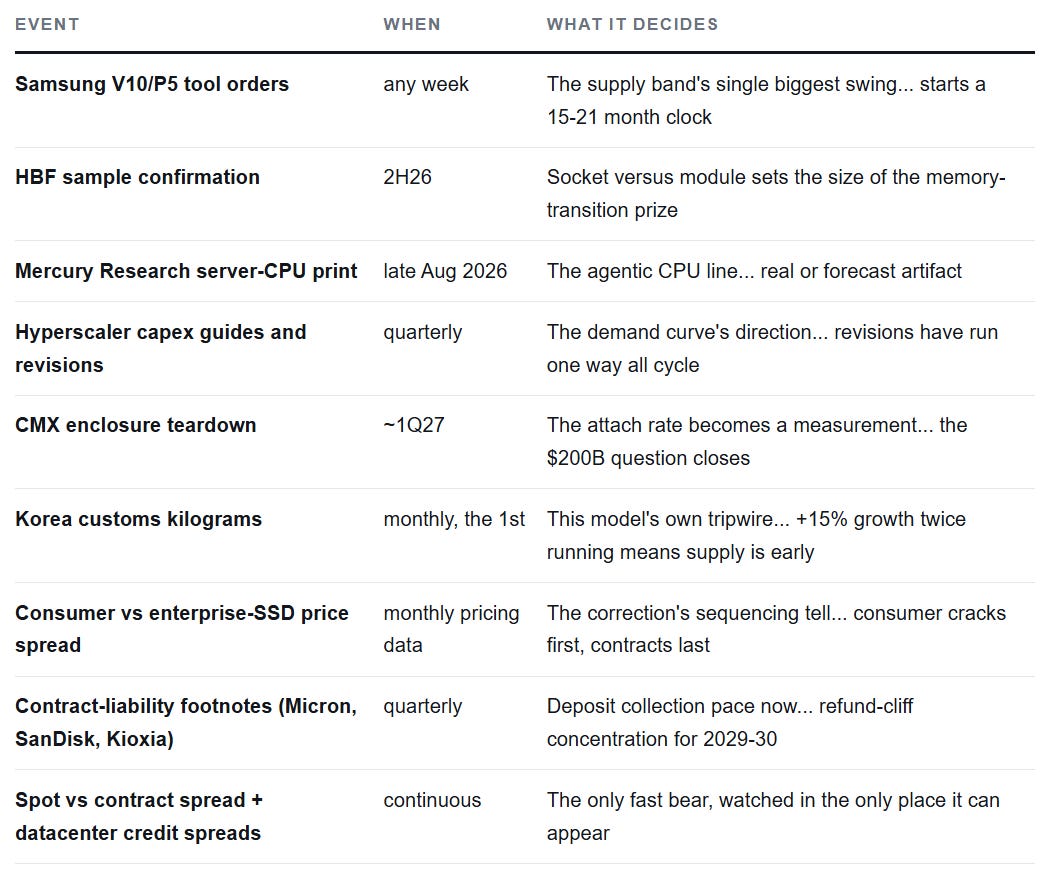
The supply is the band. The demand is the debate. The floors are the trade. The calendar settles all of it, one dated event at a time.
What does this mean for Sandisk (SNDK)…?
Subscribe to see…
