


At 2:39 a.m. EDT on Wednesday, June 17, a Falcon 9 is scheduled to lift off from Cape Canaveral carrying BlueBirds 8, 9, and 10 - three satellites with the largest commercial communications arrays ever deployed in low Earth orbit, roughly 2,400 square feet each, stacked on top of each other using a carbon-composite architecture that has never flown before.
The rocket belongs to SpaceX, and the satellites belong SpaceX’s toughest competition in direct-to-device, AST SpaceMobile… just days after the SPCX IPO. What a collision of events! The market will spend the week staring at SpaceX, but it should also be watching the payload fairing.
The Tesla moment was never the demo
People misremember Tesla’s inflection. It wasn’t the Roadster. By its June 2010 IPO, Tesla had built fewer than 2,500 cars, booked about $150 million of lifetime revenue, and carried $290 million of accumulated losses. The Roadster had already answered the only question it existed to answer (can an electric car be real and desirable?) and the market valued that answer at $1.7 billion.
The Tesla moment was everything after from buying the Fremont plant before the volume product existed, the Model S ramp, the first profitable quarter in Q1 2013, and eventually the Model 3 production hell that nearly killed the company on its way to making it the most valuable automaker on Earth. The demo got Tesla credibility. Industrialization got Tesla everything else.
AST has finished its demo phase. The physics question is retired with a standard, unmodified smartphone pulling 98.9 Mbps from a BlueBird over international waters. The FCC has authorized commercial direct-to-device service in the United States and a constellation of up to 248 satellites. AT&T, Verizon, and roughly sixty carriers representing nearly 3 billion subscribers have signed up, with over $1 billion in contracted revenue commitments reported. The FirstNet Authority literally amended its contract with AT&T to authorize AST’s service for first responders.
What hasn’t happened yet is the industrialization. That’s what June 17 starts.
Everyone forgets the explosions
Here is the part of the SpaceX and Tesla stories that gets airbrushed out of the retrospectives: they failed constantly, in public, for years.
SpaceX blew up three of its first four Falcon 1 rockets and was weeks from bankruptcy when flight four reached orbit in 2008. It then spent two solid years crashing boosters into the ocean and onto drone ships before one finally stuck the landing in December 2015. It lost a Falcon 9 and its NASA cargo in flight in 2015, and blew up another — with a customer’s satellite on top — on the pad in 2016. Starship’s development has been a literal highlight reel of fireballs. None of it mattered, because the factory behind the launch pad kept building rockets faster than the test program could destroy them.
Tesla’s version was the tent: Model 3 production began in July 2017 with a 5,000-cars-per-week target for year-end. It hit that number a year late, in June 2018, partly on an assembly line built under a temporary structure in the Fremont parking lot, with Musk describing the company as “single digit weeks” from death.
AST is now living its own chapter of this. BlueBird 7 was lost this spring when a New Glenn upper stage failed to reach its planned orbit, and Blue Origin (one of AST’s named launch providers) suffered a second major setback within weeks.
That’s a real risk and we’ll come back to it. But the lesson from the two greatest hardware-scaling stories of this generation is that lost vehicles are tuition, not necessarily verdicts. The question that actually decides the outcome is the same one it was for Tesla in 2017 and SpaceX in 2014: is the factory winning?
The factory is the story
This is what the market, fixated on launch dates, keeps skating past:
AST designs and builds ~95% of its technology in-house including its own ASICs across 500,000+ square feet of facilities with a workforce of 2,250+
BlueBirds 11 through 33 are in advanced stages of production and assembly right now, with phased arrays completed through BlueBird 28
The company says it can now manufacture up to six fully equipped BlueBirds per month at an average cost of $21–23 million per satellite for the 90+ bird constellation
The June 17 flight debuts the stackable architecture of composite carbon structures designed specifically so multiple giant satellites can ride one rocket, which is the unlock for monthly launch cadence across multiple providers
Read that list against Tesla circa 2011: factory acquired before the volume product ships, production line loaded, balance sheet stocked (~$3.5 billion in cash, with management saying no further convertible debt in 2026). The satellites stacking up in Midland are the equivalent of Model S bodies moving down the Fremont line for the first time. The hard, boring, unglamorous middle of the story, and the part that creates essentially all of the value.
And what does June 17 specifically unlock? Three more Block 2 satellites designed to nearly double peak data speeds. The first real-world test of the stacked launch system the entire 2026 cadence depends on. Progress toward the 45-satellite threshold that flips service from intermittent to continuous across the U.S., which is the trigger for commercial service gates, carrier monetization, and the FirstNet beta already being field-tested by the Texas Department of Public Safety, U.S. Customs and Border Protection, and county sheriffs on live BlueBirds. The tests that won the MNO contracts now have to hold up at scale, in the wild. That’s the whole ballgame, and it starts at 2:39 in the morning.
One S-curve, four companies
We built the timeline below to make a single point: aligned by phase instead of calendar year, Tesla, SpaceX, Starlink, and AST are the same story told four times — concept, proof, first product, production hell, payoff — and AST is standing at the exact spot on the curve where the other three went vertical.
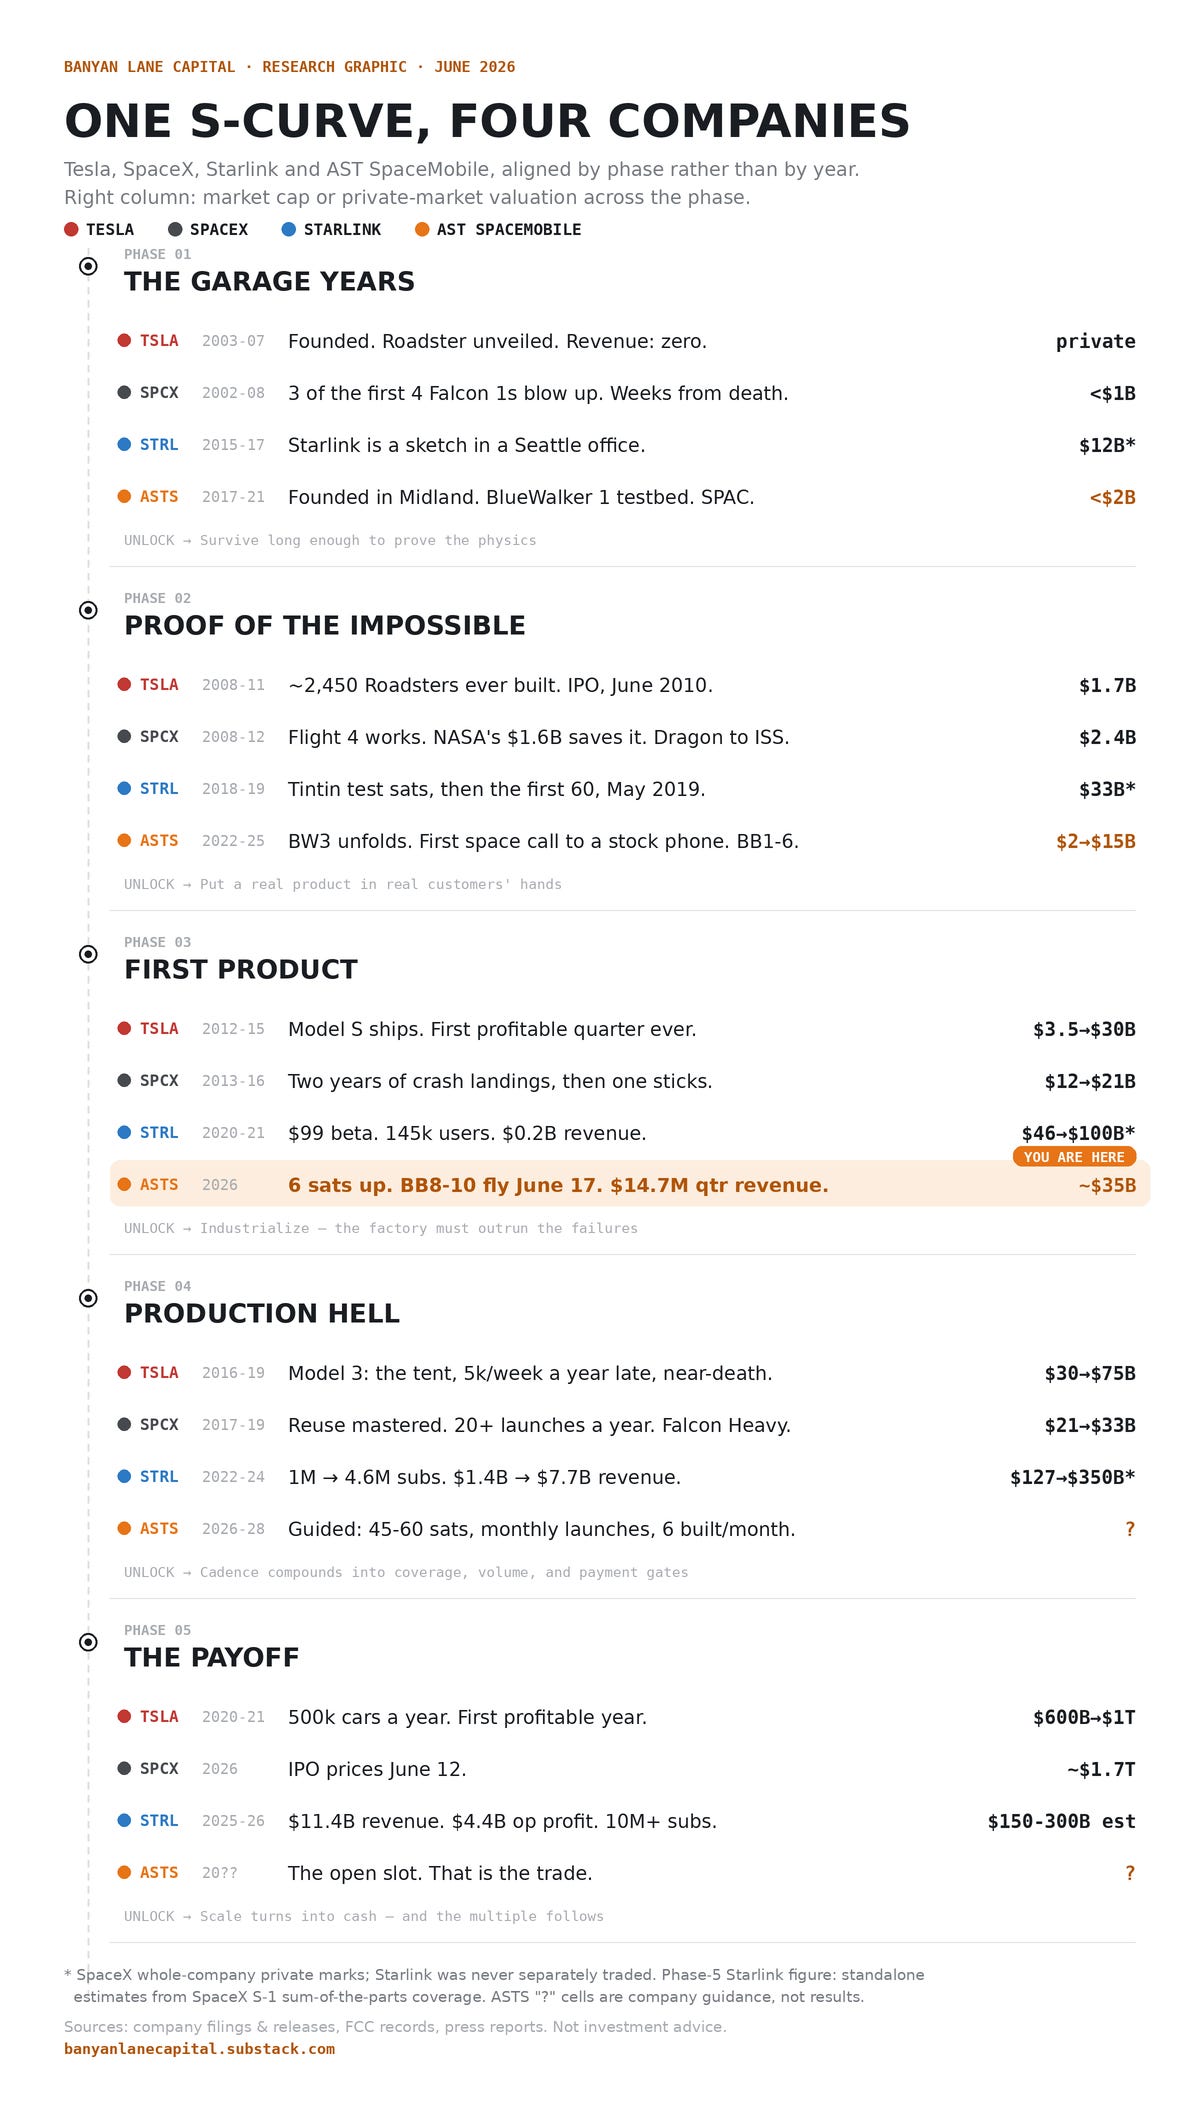
Look at the right-hand column. The valuations don’t grow through the demo phase. They grow through the industrialization phase - the one AST is entering this month. Tesla went from $3.5B to $30B while shipping its first product, then $30B to $1T through scaling. SpaceX’s private marks went from $46B to $350B to a $1.7T IPO as Starlink went from a $99 beta to $11.4 billion in revenue and $4.4 billion in operating profit in roughly five years.
That last number deserves its own sentence. Starlink, the supposed ASTS killer, is the single best evidence that ASTS’s market exists. It took a satellite connectivity business from zero to eleven billion dollars of revenue in six years, signed up over 10 million broadband subscribers, and put direct-to-device in front of roughly 12 million users across 22+ countries. The demand question is answered by the competitor.
Now plot those right-column valuations as curves, and the whole thesis fits on one chart. On a linear scale, Tesla and SpaceX are essentially flat lines through their first three phases. All of it, the $1 trillion and the $1.7 trillion, shows up in the back half. The inset magnifies phases 1–3: same track, same slope, a decade apart. ASTS’s dot sits at phase 3, at the foot of the wall the other two climbed.
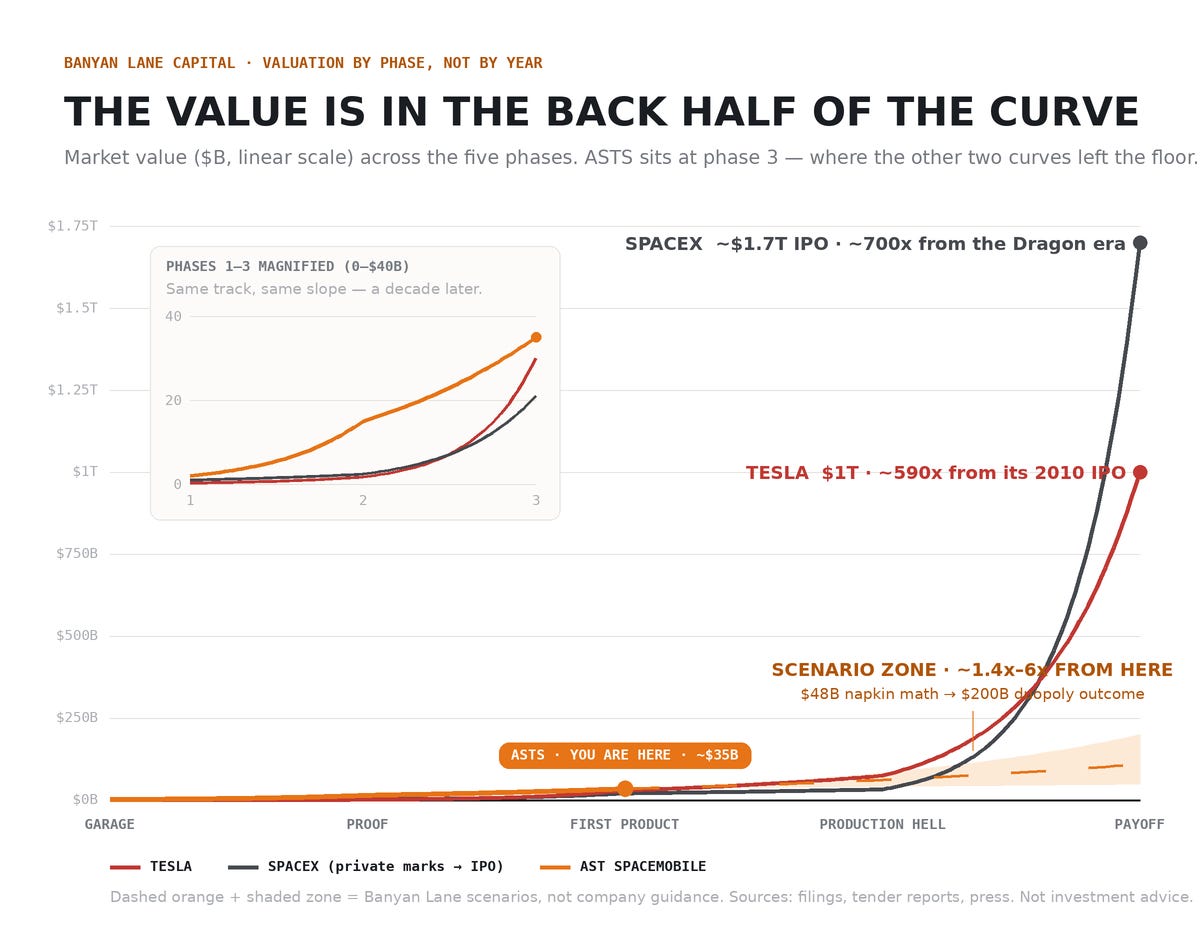
And notice what the shaded zone says: the scenario range we lay out below — $48 billion from the subscriber napkin alone, up to ~$200 billion in a full duopoly outcome — is 1.4x to 6x from today’s price, and it still barely lifts off the x-axis of this chart. The bull case here doesn’t require believing ASTS becomes Tesla or SpaceX. It requires believing it gets a fraction of the way up a wall two companies have now climbed in public.
The math nobody is doing
Here’s where it gets uncomfortable for the “it’s already priced in” crowd. ASTS trades around $89, a market cap in the neighborhood of $35 billion. Big number. Up 148% in a year. Surely the dream is in the price?
Run three simple sums.
1. The spectrum, marked to market. In 2025, EchoStar sold roughly 50 MHz of nationwide spectrum to SpaceX for ~$17 billion and a similar amount to AT&T for ~$23 billion - call it $340–460 million per nationwide MHz. AST controls 45 MHz of L-band spectrum (40 MHz MSS plus 5 MHz at 1670–1675) under an 80+ year arrangement that cost ~$550 million upfront plus ~$80 million a year, alongside FCC authorization to operate on partners’ low-band across up to 248 satellites. Apply even a steep satellite-spectrum discount to the 2025 clearing prices and the L-band position alone plausibly underpins $10 billion or more of value against a sub-$2 billion cost basis. (Caveat honestly: L-band’s device ecosystem is younger than AWS’s, and spectrum comps are directional, not fungible. But the direction is not subtle.)
2. The FirstNet program, with actual numbers. This isn’t a press-release partnership. The First Responder Network Authority is a federal agency that amended its 25-year contract with AT&T to authorize Supplemental Coverage from Space from AST specifically, on Band 14 spectrum that is licensed nationwide. Public-safety agencies are field-testing voice, data, and mission-critical push-to-talk on BlueBirds in orbit today.
Here’s the scale people miss: FirstNet now supports more than 7 million connections across roughly 30,000 public-safety agencies, including 2+ million IoT devices, and AT&T’s FirstNet chief says the true addressable count (command vehicles, deployables, backup links for 911 centers) is much larger than that. Satellite isn’t a nice-to-have for this user base; it’s the killer feature. Towers fail in hurricanes, wildfires, and earthquakes which is exactly when first responders need the network most, and exactly why FirstNet already fields a fleet of 180+ satellite-equipped deployable trucks as a workaround. AST replaces the workaround with the phone in the responder’s pocket.
So run it at a public-safety-grade price point:
7,000,000 connections × $10/month × 12 = $840M revenue × 80% EBITDA margin = $672M EBITDA × 20× = ~$13.4B of value
That’s more than a third of AST’s entire market cap, from one federal program, at full attach. ARPU could actually be much higher. Nobody has put this in a model because it doesn’t have a revenue line yet. It will.
3. The subscriber napkin. This is the one to tattoo somewhere visible:
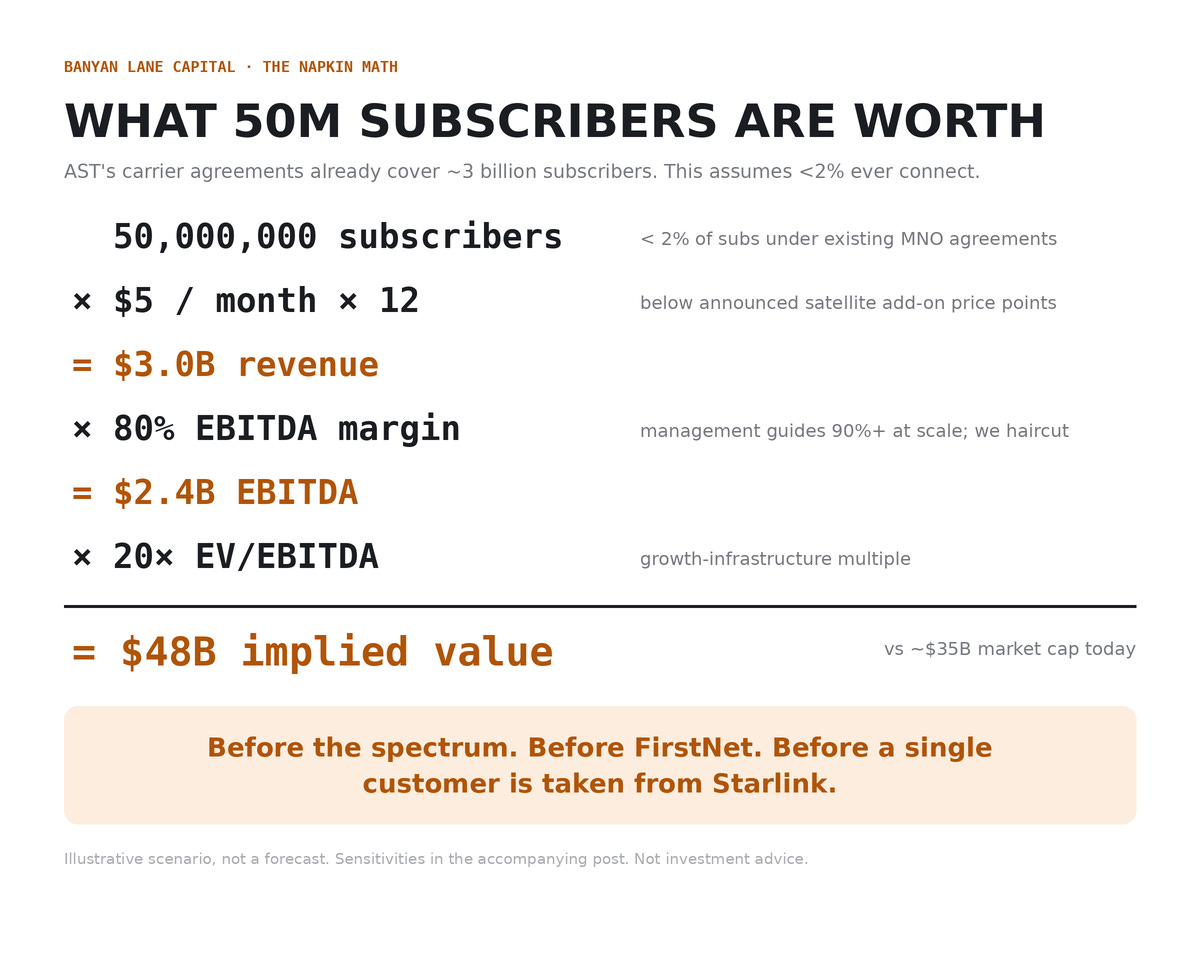
50 million subscribers × $5/month net to ASTS × 12 months = $3.0B of revenue. At an 80% EBITDA margin (management guides 90%+ at scale, because the carriers bear customer acquisition, billing, and support which AST sells wholesale capacity), that’s $2.4B of EBITDA. At 20×, a very reasonable multiple for scaling high margin infrastructure, that’s $48 billion of value from this leg alone, against a ~$35 billion market cap today. And 50 million subscribers is less than 2% penetration of the ~3 billion subscribers already under AST’s carrier agreements.
Reasonable people can fight about every cell. Starlink’s own ARPU fell 18% to $81/month as it chased scale - pricing gravity is real, which is exactly why we model $3–8 blended satellite-ARPU and not consumer-broadband numbers. Haircut the margin to 60% and the multiple to 15× and the base case is still ~$27B from subscribers alone before the spectrum, before FirstNet, before the U.S. government business that is already generating revenue today.
The point isn’t precision. The point is that none of these three legs requires AST to take a single customer from Starlink. The carriers did the distribution work already. Starlink did the market-education work already. AST just needs satellites in the sky and proof that the tests which won the contracts hold up in the wild. And here’s the asymmetry on top: every satellite launched widens the distribution moat, because continuous coverage activates dormant carrier agreements country by country — meaning scale doesn’t just defend AST’s position, it progressively improves its odds of taking share later, from a starting point of the widest carrier distribution in the industry.
What would break this
We publish bull cases with the bear case attached, so the thesis breaks if they fail to industrialize manufacturing and launch. If “up to six satellites a month” doesn’t translate into launch cadence because Falcon 9 slots stay scarce, New Glenn stays grounded, or the stacked architecture has a teething failure on the 17th, then continuous coverage slides toward 2028, the 2027 revenue inflection slides with it, and a company burning ~$190M a quarter against $14.7M of quarterly revenue gets re-rated the way pre-ramp hardware companies always do. Tesla’s history says slips of 12–24 months are the normal case, not the disaster case; ASTS’s valuation, unlike 2010 Tesla’s $1.7B, does not have infinite patience priced in. Watch the cadence, not the narrative. Satellites delivered to the Cape per quarter is the only KPI that matters this year.
But that cuts both ways. If the cadence holds, if BlueBirds keep arriving at the pad every month or two the way Roadsters once trickled and Model S’s eventually flooded out of Fremont, then the market is currently valuing the exponential part of this S-curve at roughly the price of its first leg.
Tesla’s IPO buyers got the curve for $1.7 billion. SpaceX’s insiders got Starlink’s curve at private marks that look comical against Friday’s IPO. AST is offering its curve in public, at $89, with the satellites already stacked on the rocket.
June 17, 2:39 a.m. EDT we’ll find out more.
DISCLOSURE
Position: At the time of publication, the author holds a position in AST SpaceMobile (ASTS).
Trading Policy: The author will not materially alter this position within 48 hours of publication. After this period, the author may buy, sell, or otherwise adjust the position without further notice. Changes to the author’s view or position will be reflected in subsequent publications when material.
Conflicts: The author has received no compensation from the issuer or any party with a financial interest in this security.
Forward-Looking Statements: This report contains the author’s opinions, estimates, and projections, including price targets derived from financial models. These are forward-looking statements subject to substantial uncertainty. If these assumptions prove incorrect, the actual value may differ materially, including scenarios of significant loss or total impairment. The price target represents the author’s estimate of fair value under the stated assumptions, not a prediction of where the stock will trade.
Risk Warning: Short selling involves unique and potentially infinite risks, as there is no theoretical limit to how high a security’s price can rise. Past performance is not indicative of future results. You should consult with a qualified financial advisor and conduct your own rigorous due diligence before making any investment decisions.
This report is provided for informational purposes only and does not constitute investment advice. See the full Terms & Disclosures for additional important information.