


On April 30, 2026, alongside Murata Manufacturing’s FY2025 earnings release, the company announced ¥80 billion (~$500 million USD) of additional MLCC capital expenditure on top of an already-elevated ¥250B FY2026 capex plan. The investment is split between this year and next, focused on the Izumo plant in Shimane Prefecture and other existing MLCC facilities, targeting small-size, high-capacity MLCCs, which is the exact specification used in AI server power delivery.
This was buried in a long earnings deck and most US-based readers have not seen it. The Japanese-language coverage from Nikkan Kogyo Shimbun (Japan’s leading industrial trade publication) is the cleanest version of the story, and it includes management quotes that change the tenor of the thesis materially.
What Management Said
President Norio Nakajima at the FY2025 results announcement on April 30, 2026, as quoted in Nikkan Kogyo Shimbun (May 6, 2026 edition):
「各ボトルネックの工程を埋め合わせることを優先する」
“We need to prioritize filling each bottleneck process.”
「十分な能力を持って需要に対応できたかというと、まだまだ不十分。急ぎ設備投資を決めた」
“As to whether we have had sufficient capacity to respond to demand: the answer is still very much insufficient. We hurried to decide on this capital investment.”
The language matters. 「急ぎ」(isogi) means “in haste” or “rushed.” Japanese corporate communication, especially from a 76-year-old industrial blue-chip like Murata, almost never uses this word about capex. It signals that the decision was made under operational pressure, not as part of a routine medium-term plan.
「まだまだ不十分」(mada mada fujuubun) translates to “still very much insufficient” or “still far from sufficient.” The doubled “mada mada” is an emphatic construction. A direct English equivalent is “we are nowhere close to having enough capacity.” For a company that has historically guided 15-25% below initial-year actuals to publicly say their capacity is “still very much insufficient” is unusual.
This is the single largest MLCC supplier in the world telling investors and customers that they are losing the supply battle, and they are spending money to catch up because they have to.
To corroborate the demand picture, Nakajima had previously told Bloomberg in February 2026:
「同社のMLCCの引き合いも供給能力に対して倍ぐらいの水準になっている」
“Customer inquiries for our MLCCs are running at roughly twice our supply capacity.”
「AI自体は産業革命と同等の変化であり、一時のブームではない」
“AI itself is a change comparable to an industrial revolution, not a temporary boom.”
What’s Embedded in the FY2026 Guidance That Most Missed
The FY2026 forward-looking section of Murata’s earnings deck contains a dataset that, when read carefully, validates the supply/demand thesis at the segment level:
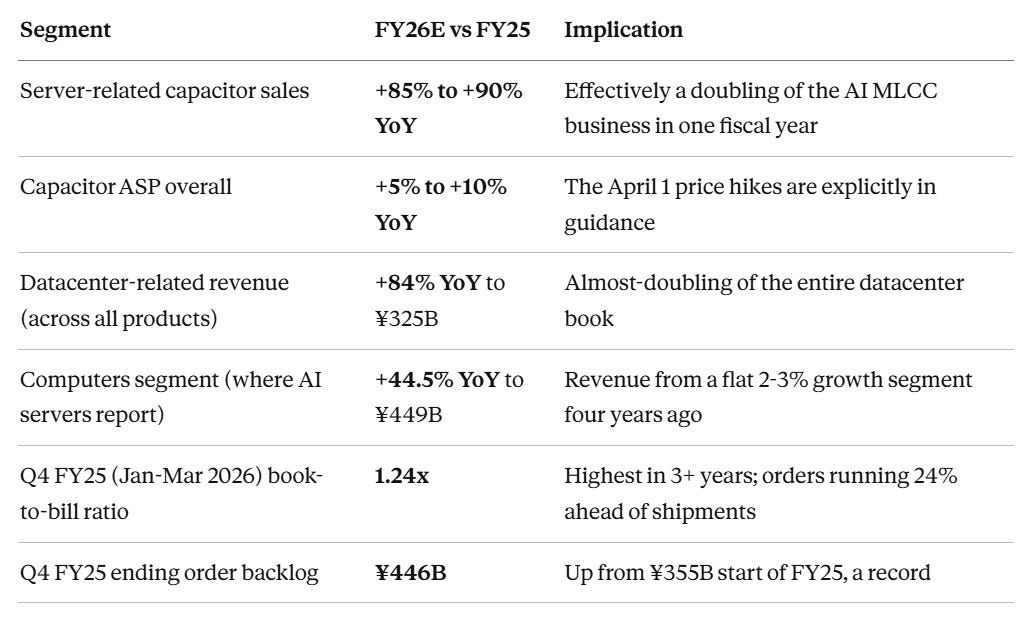
Despite all of this, the headline FY26 operating profit guide is ¥380 billion, which is what consensus ran with. The guide reflects Murata’s habitual conservatism, not the trajectory of the underlying segment data they themselves disclosed.
There is also a tell in the FY2025 challenges-and-achievements slide of the earnings deck. Under “Acquiring demand for AI server power supplies,” management wrote:
“We had secured orders for secondary modules for hyperscalers; however, the orders were subsequently dropped due to defects caused by a firmware update.”
Murata is openly admitting they lost AI server orders due to operational issues, while at the same time announcing emergency capex. The combination (AI orders flooding in, some lost due to defects, now rushing to expand) is exactly what a constrained supplier does in a tight market.
Tying MLCC Demand to AI Capex: The Numbers The Market Is Actually Watching
The top 5 hyperscalers (Microsoft, Google, Amazon, Meta, Oracle) spent $448B on capex in 2025. April 30 earnings calls put combined 2026 spending at $700-725B, with Microsoft alone tracking to $190B versus a $120B initial plan. Bank of America and Evercore both now have 2027 above $1 trillion. Goldman Sachs has 2025-2027 cumulative hyperscaler capex at $1.15T, more than double the $477B spent in the prior three years.
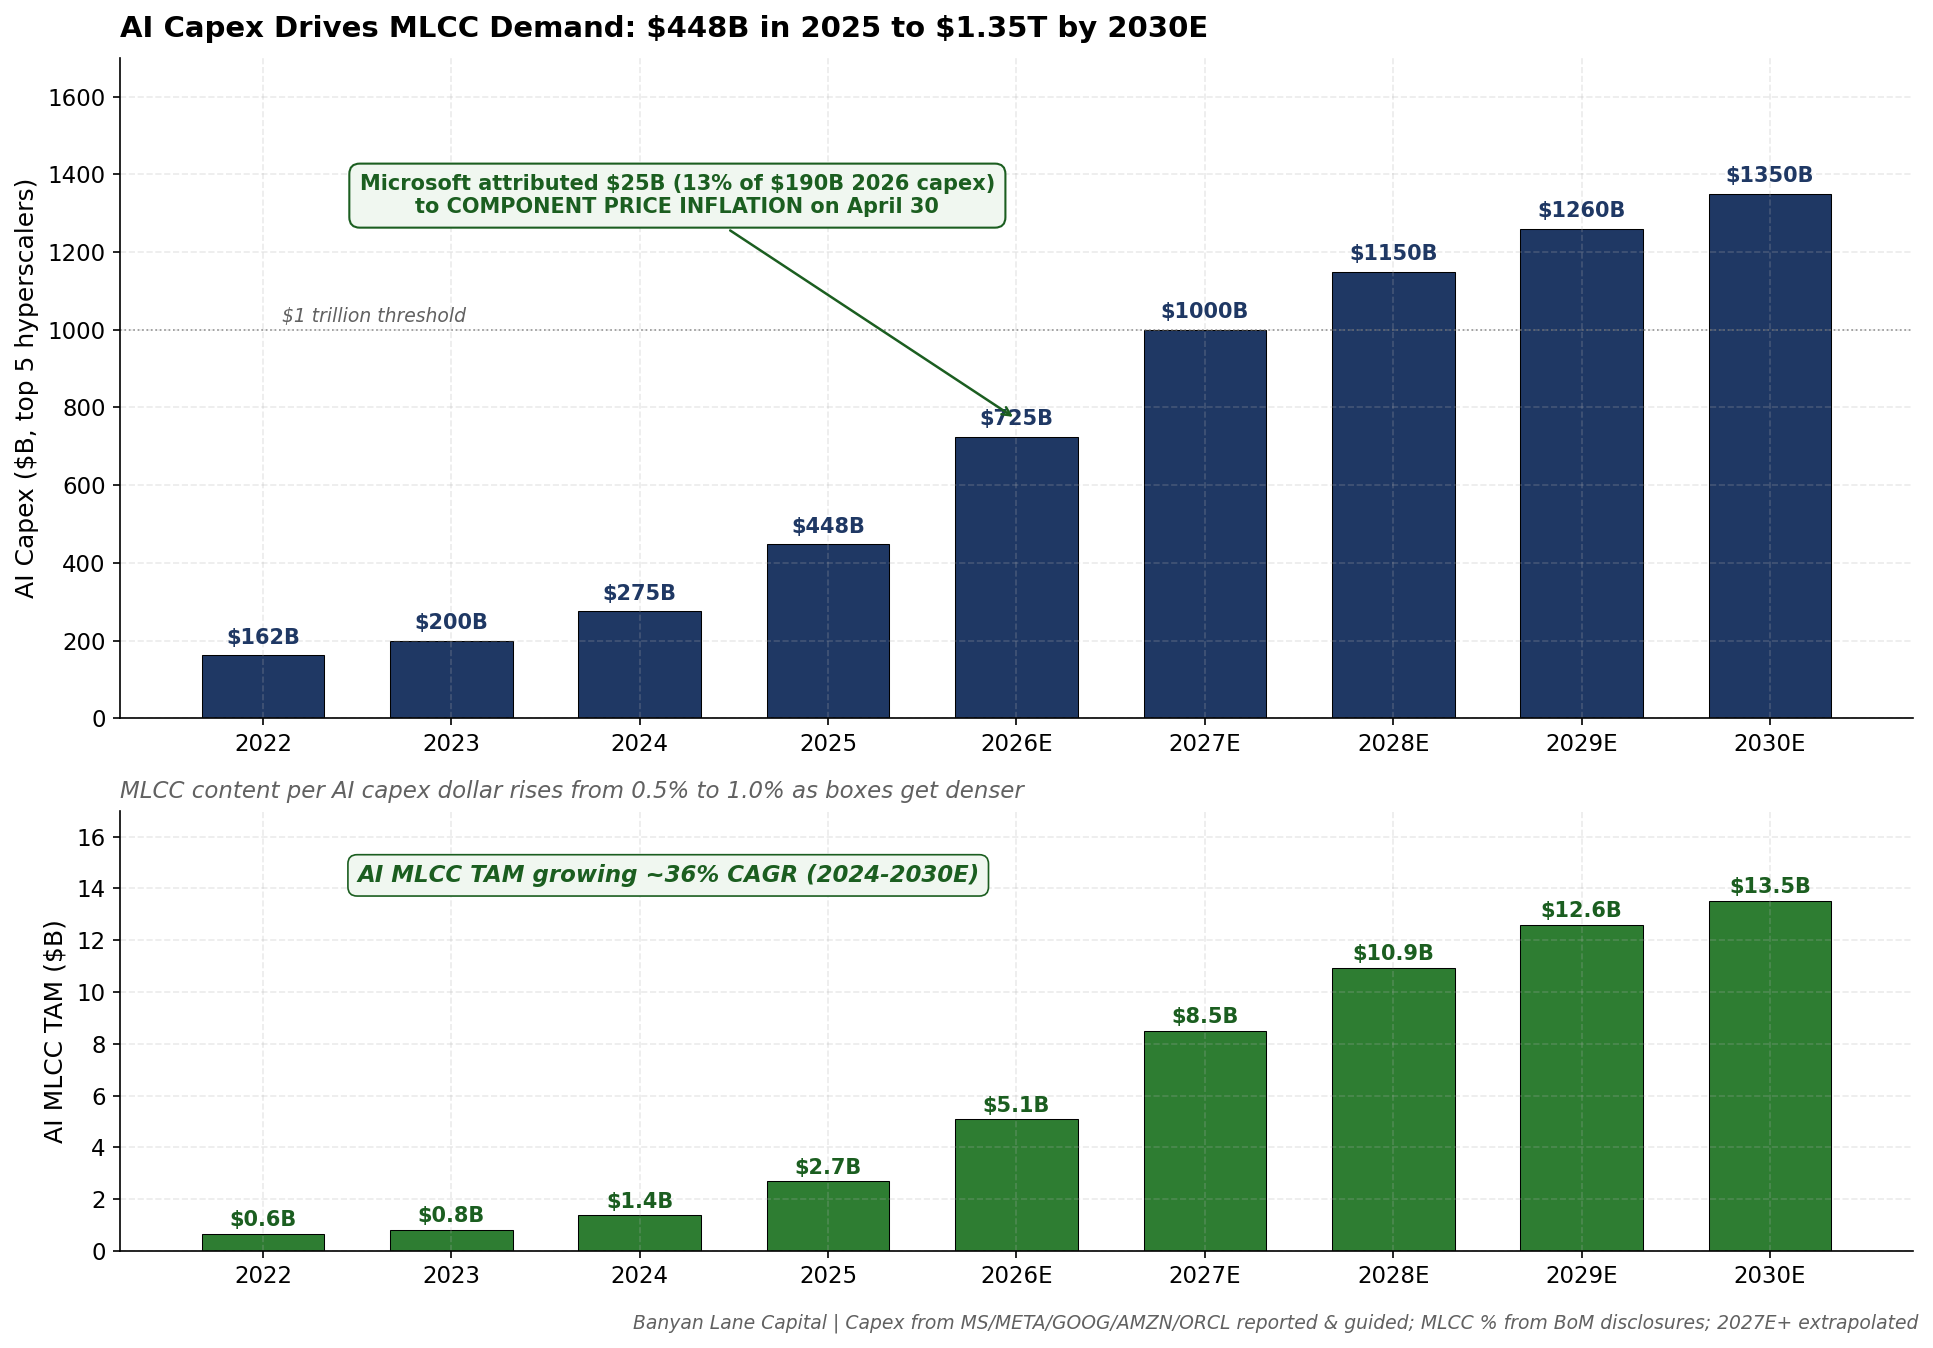
Two data points from the April 30 prints matter for the MLCC thesis specifically:
Microsoft attributed approximately $25B of its $190B 2026 capex to component price inflation. That is 13% of total capex coming from component pricing alone, not from buying more units. Hyperscalers are openly acknowledging that components are taking a bigger share of the bill because suppliers can charge for it.
AI capex is rising faster than MLCC supply can. MLCC content per AI capex dollar is somewhere between 0.5% and 1.0%, with content rising as boxes get denser (Blackwell to Rubin to Rubin Ultra). Multiply: AI MLCC TAM goes from roughly $2.7B in 2025 to roughly $13B+ by 2030E. Murata at 60% AI MLCC share captures the largest single slice of that growth. And, as mentioned in our last post on Murata Part 1, the spread between supply and demand is set to grow for multiple years, compounding the imbalance.
Why the Pricing Case Just Got Stronger
Our original model assumed AI MLCC ASP rising from ¥3.0 in FY24 to ¥4.8 by FY28E, with one additional round of price hikes after the March 2026 round. After everything Murata put on the table April 30, that pricing trajectory looks materially too conservative for several reasons.
First, the shortage is bigger than 2018. The 2017-2018 cycle was a shortage of everything (commodity and high-end MLCCs), but only acutely tight for 12-18 months. The current cycle is a shortage of premium AI-grade MLCCs specifically. It is narrower in segment but larger in percent terms within that segment, and the duration is structurally longer because Rubin, Rubin Ultra, and Feynman are all designed with MLCC-heavy power delivery, and the demand ramp runs through 2030.
Second, capacity additions cannot keep up. Each new AI-grade MLCC production line takes 24-30 months from board approval to commercial yield. Murata’s ¥80B emergency capex adds 10-15% capacity. SEMCO’s Philippines plant ramps in late 2027. Taiyo Yuden and TDK are doing incremental adds. None of these are sized for what’s coming.
Third, the market needs a much stronger pricing signal. While not disclosed, our back-of-the-envelope math suggests greenfield capacity for high-end MLCCs requires roughly 4-5x current ASPs to clear the ROIC hurdle at incumbent levels of capital intensity. The first round of price hikes (15-35% in March 2026) is not enough. The 2018 cycle saw four discrete rounds of hikes (Q1 2017, Q3 2017, Q1 2018, Q3 2018), and Murata’s MLCC ASP roughly doubled trough-to-peak. That is the historical floor, not the ceiling, for what is possible in this cycle.
Fourth, hyperscalers can absorb every plausible price increase. A Blackwell NVL72 rack contains 441,000 MLCCs at roughly $0.30 average ASP. That is $130,000 of capacitors in a rack that costs $3-4 million all-in. MLCCs are 3-4% of BoM today. At the asymmetric scenario peak ASP (¥8.5/unit, roughly $0.55), MLCC content rises to ~$240,000, still only 6-7% of rack cost. Even a 3x price hike from current ASPs leaves MLCCs at less than 10% of rack BoM. Hyperscalers will not delay GPU deployment to save a few percent on capacitor pricing. They will pay. This is the underlying reason multi-round pricing is sustainable: the customer base genuinely cannot push back.
The Pricing Scenario Framework
We now model four scenarios based on the number of price hike rounds through FY30:
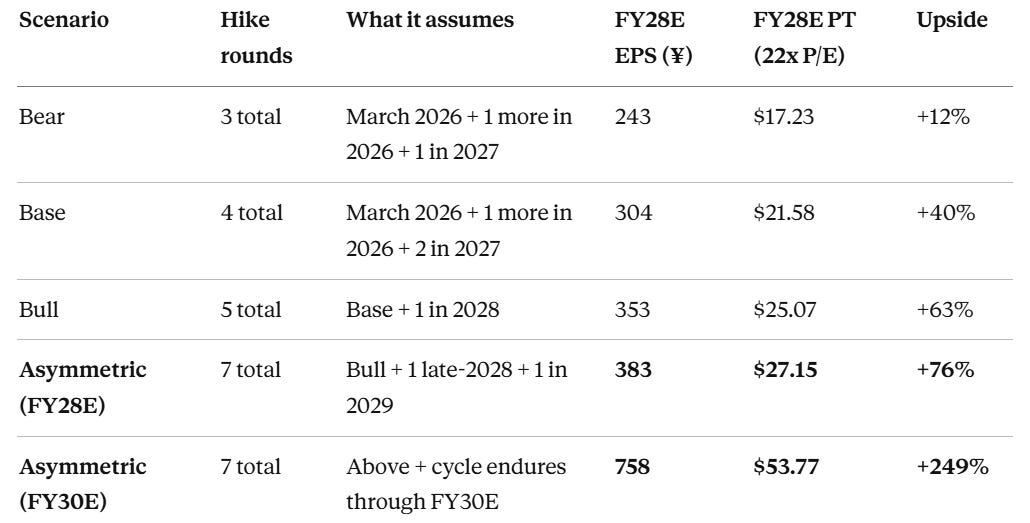
Per-round price increase on AI MLCCs assumed at 18%, which is conservative versus the 20-35% range seen in 2017-2018. The Bear case sits below the 2018 cycle in cadence. The Base case roughly matches it. Bull and Asymmetric run above 2018 because the AI MLCC demand growth structurally outpaces what smartphone-driven demand did then.
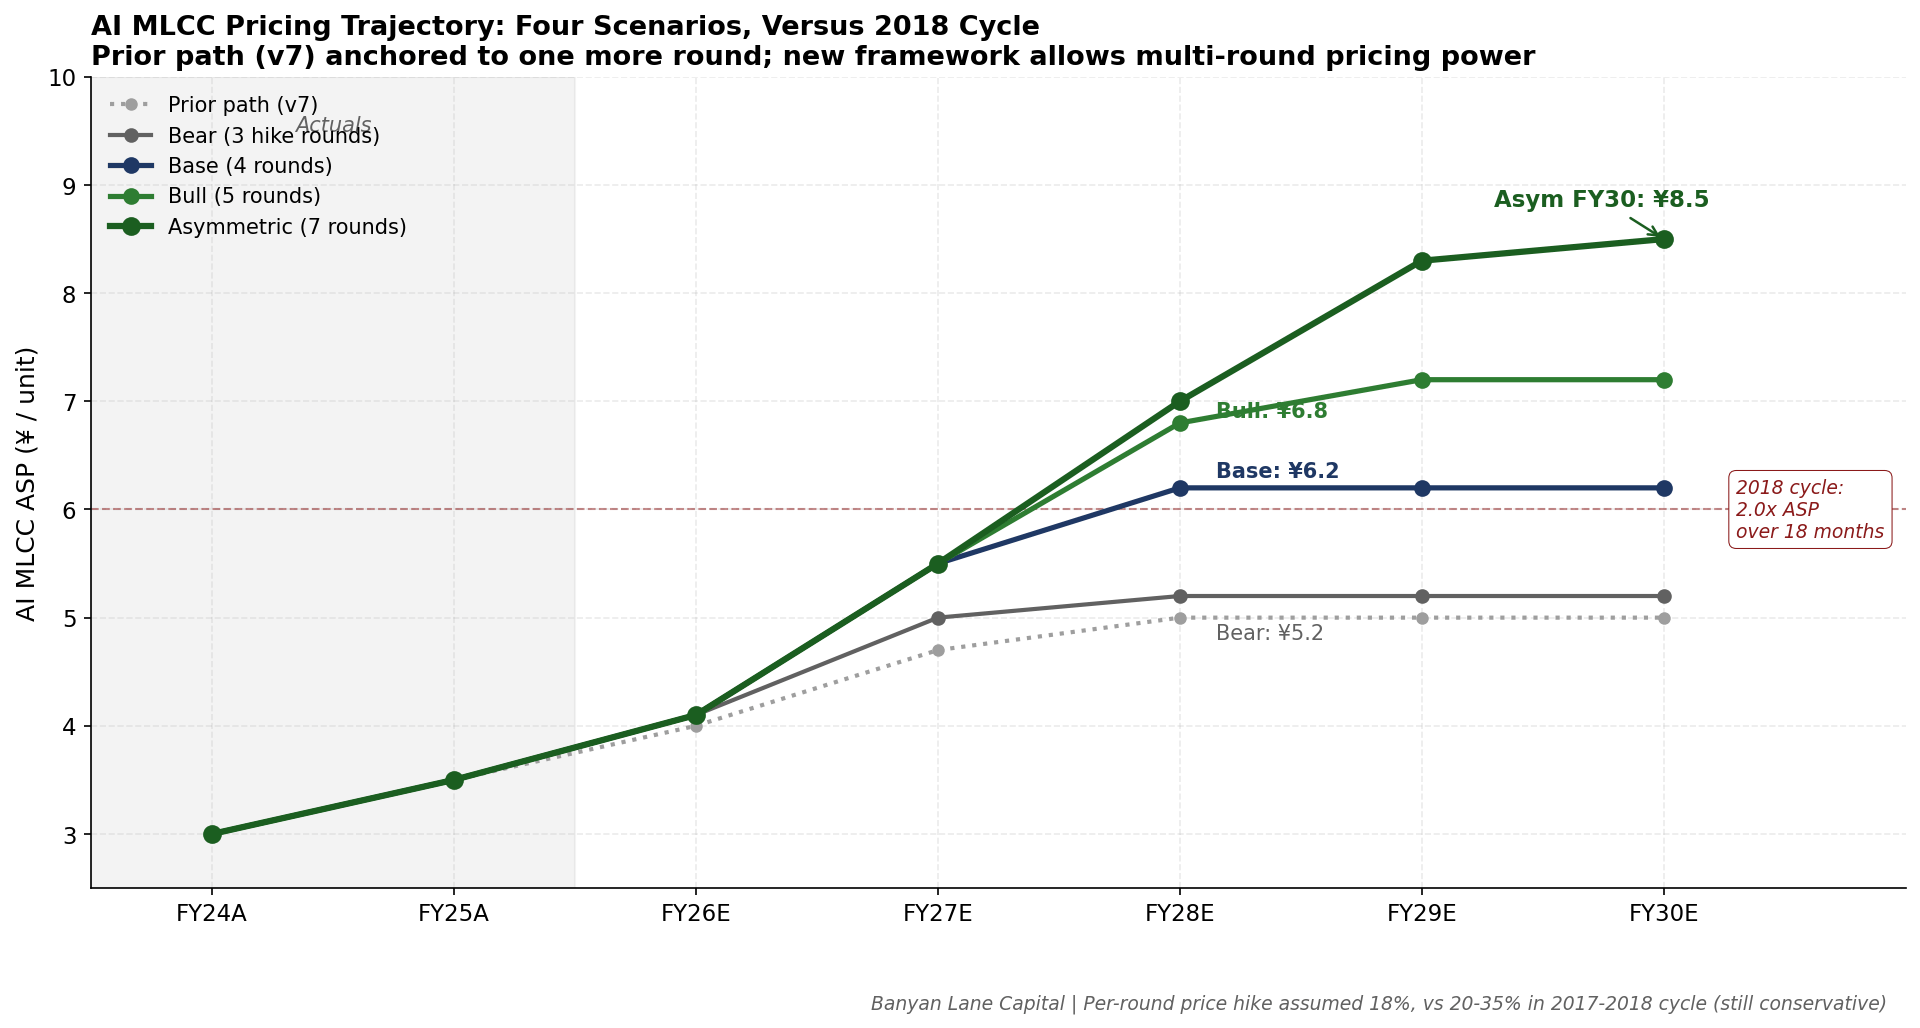
The pricing trajectory chart shows how each scenario plays out against the prior v7 path and the 2018 cycle reference (red dashed line at 2.0x). The Asymmetric case reaches ¥8.5 by FY30, a 2.83x trough-to-peak that exceeds the 2018 cycle but is justified by the longer demand ramp and structurally tighter supply response.
The Supply / Demand Gap Persists Through 2030
The reason pricing pressure continues to build is that capacity additions do not catch demand even by FY30 under reasonable assumptions:
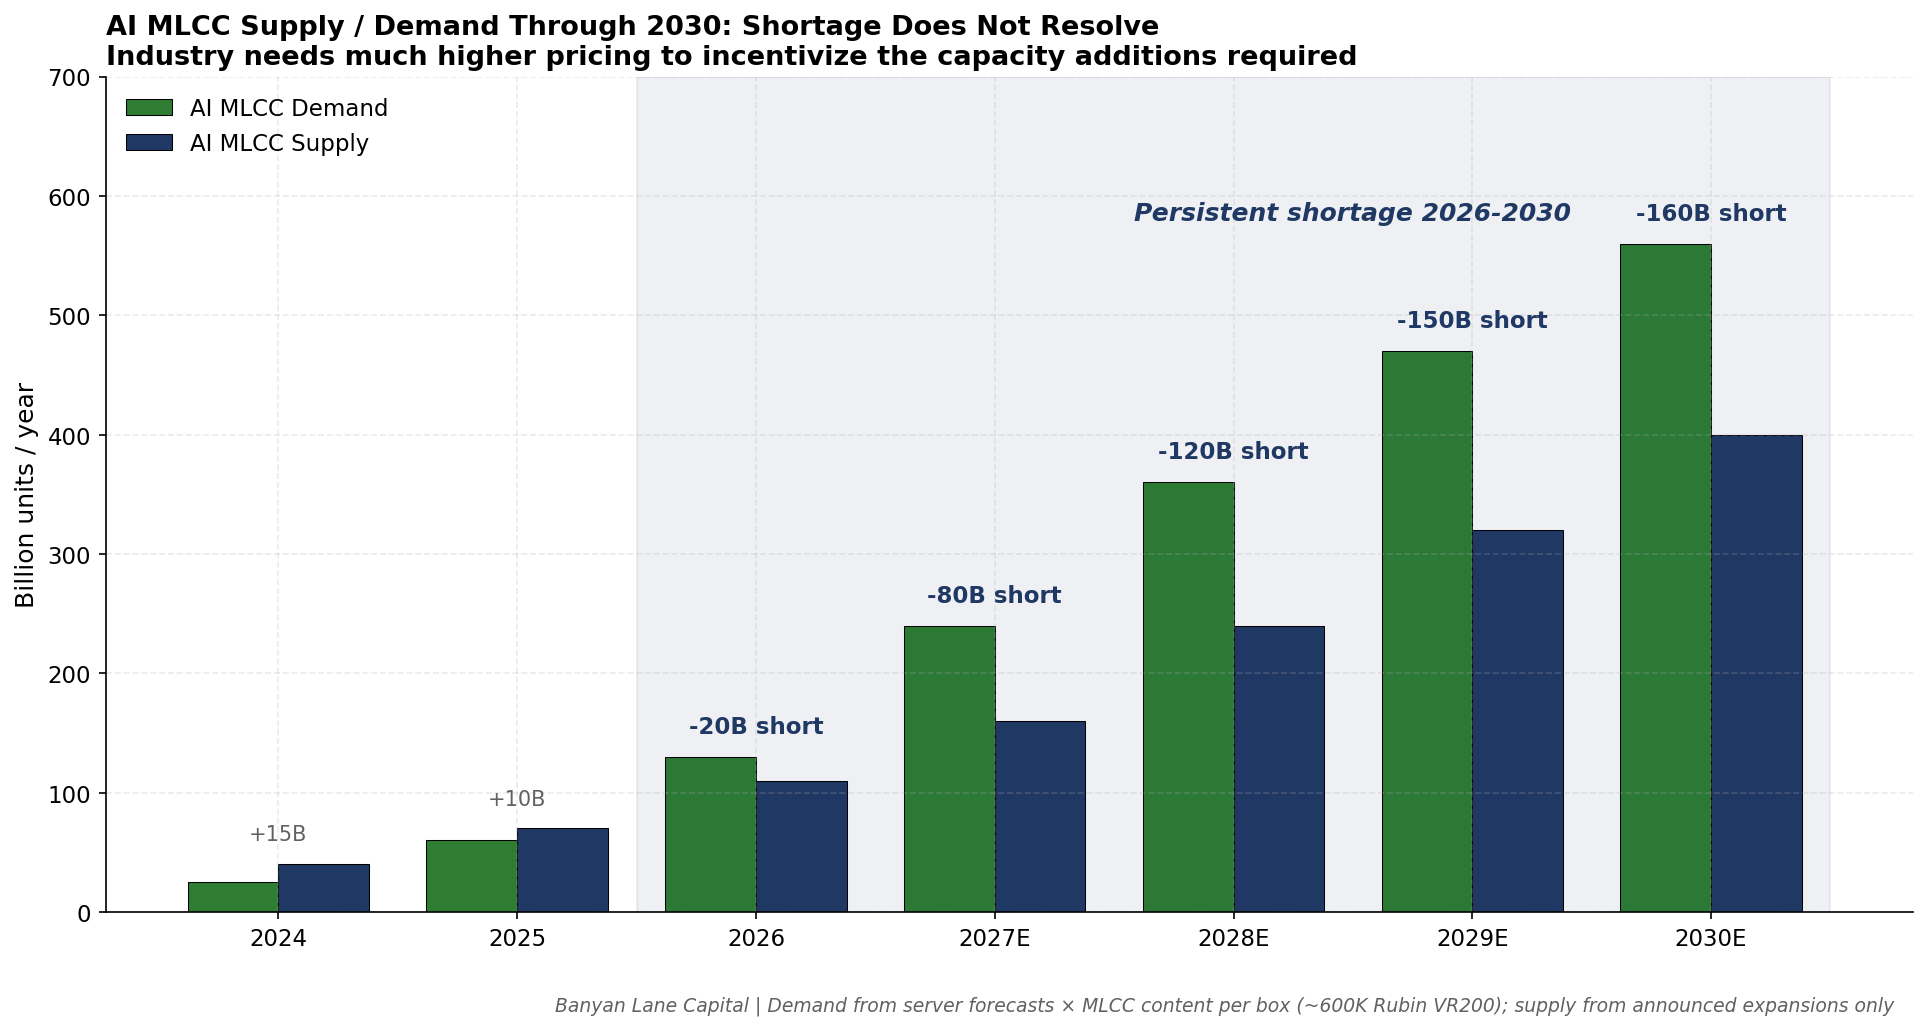
Annual deficit: -20B units (2026) → -80B (2027E) → -120B (2028E) → -150B (2029E) → -160B (2030E). The gap widens, it does not close. For supply to materially catch demand, the industry would need 3-4 new high-end MLCC plants approved in the next 12 months. None are. The capex math simply doesn’t work at current ASPs.
This is the inversion that gets the asymmetric pricing case to over 7 rounds of hikes. The market has to send a much stronger price signal to incentivize the capacity additions required. Until it does, the existing incumbents (Murata, SEMCO, Taiyo Yuden) keep capturing rent.
Headline Financial Outcomes by Scenario
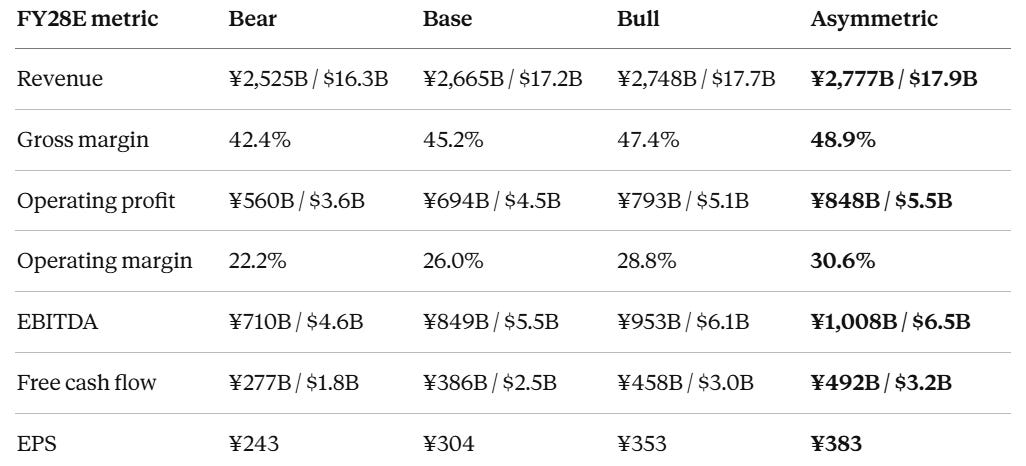
Why The Base Case Alone Is Compelling, And Why The Asymmetric Case Is Where The Conviction Sits
The base case gives 25% IRR over 18 months on what is now a much better-supported assumption set than what was in place at original publication. The asymmetric case at 76% upside on FY28E is where the conviction really sits, because the supply/demand gap supports continued pricing power well beyond FY28E.
The Asymmetric Case Through FY30
Extending the asymmetric case to FY30 captures the durability of the cycle:
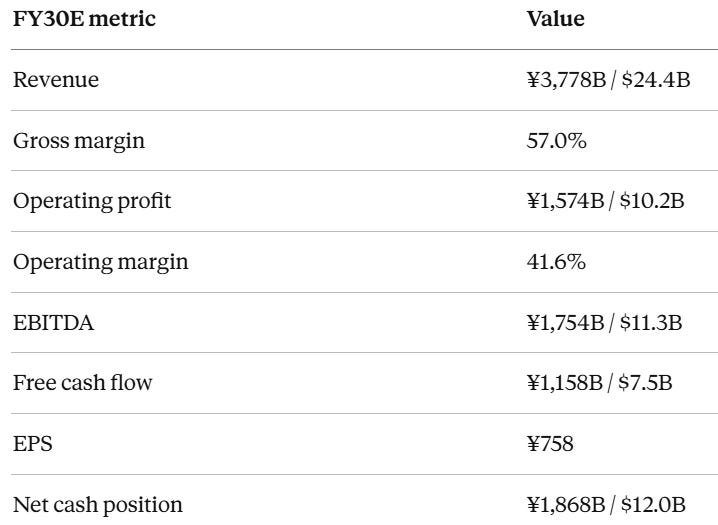
Per the framework table above, this gets to MRAAY $53.77 at a 22x P/E multiple (+249% upside, +43% annualized IRR).
This is what a multi-year structural pricing cycle in a high-fixed-cost industry with disciplined incumbents looks like in the financial model. It is not a one-year pop.
Where the Cash Goes (and Why More Buybacks Are Highly Likely)
Murata’s balance sheet was already underlevered before the buyback. Even after the ¥150B buyback announced April 30 (largest in company history), the asymmetric case has the company sitting on net cash of $10-12B USD by FY30. That is more cash than they need for any plausible capex or M&A program.
Three factors converge to make additional buybacks highly likely through the cycle:
Underlevered balance sheet. Debt-to-equity of 0.02. They have essentially no leverage to optimize, so excess cash sits there.
Improving Japanese corporate capital allocation. Murata’s Medium-Term Direction 2027 explicitly switched ROIC measurement from pre-tax to post-tax and set capital efficiency as a primary KPI. Their FY26 guide is ROIC of 12.3% post-tax (up from 9.7%), with WACC at roughly 7%. They have publicly committed to capital returns “with the aim of improving capital efficiency.”
Disciplined capex history. Murata has historically targeted ROIC well above WACC and has consistently under-built in cyclical upcycles when peers over-built. This is the company that lost AI server orders to firmware issues and is now doing emergency capex, not the company that builds speculative capacity. That discipline is bullish for pricing because it means industry capacity additions stay constrained.
The asymmetric case explicitly bakes in ¥900B of cumulative buybacks FY26-FY30 (¥150 + ¥200 + ¥250 + ¥300 = compound rate growing with the cash flow), taking the share count from 1.95B to 1.62B by FY30. That assumption can be conservative if cash builds faster than modeled, which it likely does in the bull and asymmetric pricing scenarios.
This is the underappreciated angle. Most cyclicals destroy capital allocation at the peak. Murata is set up to compound capital efficiency through the cycle because management is doing the right things on both sides of the balance sheet.
What the Capex Means for Competitive Dynamics
This is where the read-through is most important and the news is most under-appreciated.
There are four real producers of AI-grade MLCCs globally. Here is the capacity expansion timeline:
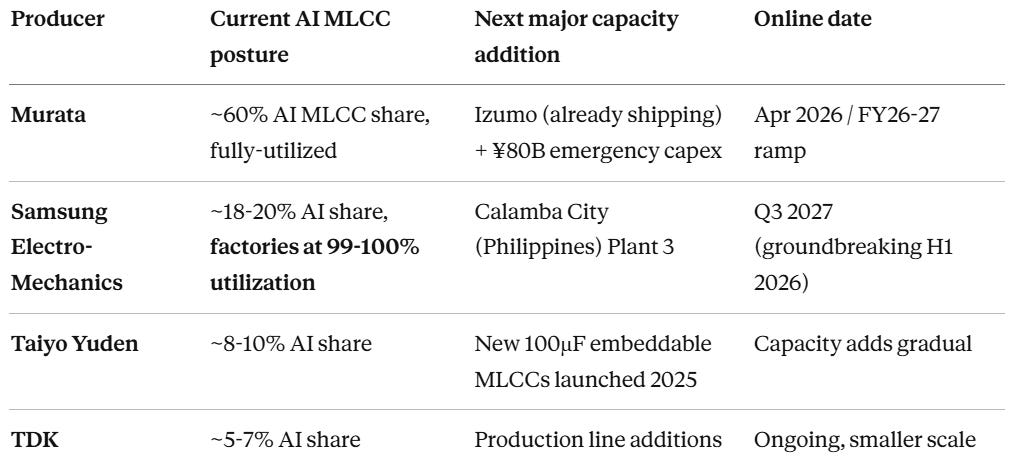
Three observations:
1. SEMCO is at 99-100% utilization right now. Korean media (Seoul Economic Daily, March 25, 2026) confirmed SEMCO’s MLCC factory utilization rates have “effectively reached 100%.” Their next material capacity addition is the third plant in Calamba City, Philippines, with groundbreaking in H1 2026 and commercial production starting July 2027 at the earliest. SEMCO publicly stated their MLCC production for next year is “already sold out.”
2. Murata’s ¥80B incremental capex widens the supply gap in 2027 specifically. SEMCO’s Philippines plant doesn’t ship until late 2027. Murata’s incremental ¥40B in FY26 + ¥40B in FY27 spending hits existing facilities (much faster ramp than greenfield), with most output coming online through 2027. There is now a ~12-month window in 2027 where Murata is adding capacity faster than the market overall.
This is the period where Banyan Lane’s model has Murata’s effective AI MLCC share nudging higher to the high-50s percent in FY27 before settling back as SEMCO’s Philippines plant ramps in late 2027 and 2028.
3. None of this fixes the supply/demand gap inside the thesis horizon. Total incremental capacity from Murata’s ¥80B is ~10-15% of their existing MLCC base. Across the industry, even with SEMCO Philippines online by mid-2027, capacity additions through end-2028 are estimated at 25-35% above today’s level. Banyan Lane’s model has AI MLCC demand growing at 80%+ CAGR through 2028. Capacity additions of 25-35% don’t close a 4x demand gap. The shortage remains the central feature of the trade.
The competitive read-through: Murata is using its capex flexibility to take advantage of SEMCO’s slower ramp. They’ve also stated publicly their share is roughly 60% of AI MLCCs and they have multi-year long-term agreements with most major customers. The window where Murata gets to set the price unilaterally is wider than the headline competitive structure suggests.
Will an MLCC Shortage Inhibit AI Chip Output? Probably Not, But Worse for Hyperscalers
A reasonable question raised in the comments to the original post: if MLCCs are this tight, will the shortage actually hold back AI chip shipments?
The honest answer: almost certainly not for tier-1 hyperscalers, but yes for parts of the broader market.
Three reasons MLCC shortage doesn’t break NVIDIA shipments through Rubin:
1. HBM and CoWoS are the binding constraints, not MLCCs. NVIDIA management has stated repeatedly that HBM3E supply is fully allocated through 2026. CoWoS-L packaging capacity is “oversubscribed through at least mid-2026” per TSMC. These are physical bottlenecks at $9-15B fab-scale facilities. MLCCs at 3-4% of rack BoM are economically immaterial in comparison, even at peak ASPs.
2. Hyperscalers are tier-1 priority customers. During the 2017-2018 MLCC shortage, Apple, Samsung Electronics, and Tesla all received full allocation. The line-stops happened at tier-2 and tier-3 OEMs (GoPro publicly admitted under-producing cameras due to MLCCs; Sony PS4 production was constrained). Today’s hyperscalers (Microsoft, Meta, Google, Amazon, Oracle, xAI) are explicitly prioritized. Murata management said multi-year LTAs with these customers mean “supply is not a concern.” Murata is taking care of the priority tier first.
3. MLCC production is more flexible than HBM/CoWoS. Even during peak 2018 shortages, MLCC manufacturers maintained allocation regimes that delivered some product to most major customers. Existing line capacity expansion takes 18 months; emergency capex like Murata’s ¥80B can be online inside 12-18 months on existing buildings. HBM and CoWoS expansions take 36-48 months.
Where shortages may actually bite:
Mid-tier server OEMs without long-term agreements (Dell, HPE, Supermicro non-priority lines)
Industrial computing (Honeywell, Schneider, ABB) which competes with hyperscalers for the same high-capacity parts
Automotive Tier-1s during the 2027 EV cycle ramp, especially Chinese and European players
Smaller AI chip makers (Cerebras, Groq, SambaNova) which cannot command priority allocation
The pattern from 2018 holds: the shortage is real, but it allocates pain to tier-2/tier-3 customers while tier-1 customers pay through the nose to maintain supply. That dynamic is what gives Murata pricing power. It’s not that AI chip output gets capped by MLCC availability; it’s that AI chip output gets supplied at MLCC prices that go up 25-50% per round of negotiations.
How Often Did Prices Rise in Past Cycles?
This is the question that sets up the next round of model upgrades.
In the 2017-2018 super cycle, prices on standard-spec MLCCs rose 5-10x over 18 months (BlockBeats analysis), with lead times moving from 4-8 weeks to over 30 weeks. The cadence of price increases:
Q1 2017: First round of hikes, 5-15% on commodity grades
Q3 2017: Second round, 15-25% on standard grades, larger on specialty
Q1 2018: Third round, 20-35% on most grades, 50%+ on supply-constrained sizes
Q3 2018: Fourth round in some categories, smaller magnitudes
2019: Hikes stopped as demand collapsed (post-iPhone X, ahead of trade war)
Murata explicitly raised prices multiple times per cycle when the market was tight. Taiyo Yuden, Samsung Electro-Mechanics, and TDK followed within 1-2 quarters each time. The 2018 cycle saw four discrete rounds of hikes, and Murata’s reported MLCC ASP roughly doubled from FY16 to FY19 peak.
The current cycle started its first round of hikes in March-April 2026 (Murata: 15-35%; Taiyo Yuden: 6-13%; SEMCO: 5-10% in negotiations). Historically, the cadence between rounds 1 and 2 was 2-3 quarters. That puts the next round of price increases somewhere between September 2026 and February 2027 and well within the thesis horizon, and likely larger than the first round given that book-to-bill remains above 1.0 and lead times are still extending.
Goldman Sachs noted on March 18, 2026 that “the reported price hikes for MLCCs in particular, if accurate, would likely have positive implications for Murata Mfg., Taiyo Yuden, and the industry as a whole, largely because we believe most investors have factored in Murata Mfg’s prior comment that it would consider price hikes from mid-2026 onwards.” Murata moved earlier than the Street expected. We think they will move again, also earlier than the Street is currently modeling.
What Would Change The Updated View
Things that would make Banyan Lane more confident in the upgraded targets:
Q1 FY27 print (late July 2026) showing Murata gross margin above 40% and operating margin above 22% (model has 41.7% / 20.8% by FY26 average)
Second round of Murata price hikes announced between September 2026 and February 2027, magnitude 20-35% on AI parts
Order backlog continuing to grow above ¥446B for two more quarters
SEMCO Philippines Plant 3 ramp delay beyond July 2027 (would extend Murata’s window)
Things that would force a downgrade:
Murata book-to-bill drops below 1.0 for two consecutive quarters
Hyperscalers guide flat-to-down 2027 capex in late-2026 prints
NVIDIA confirms eDTC adoption for Rubin Ultra (would pull substitution risk forward by 12 months)
SEMCO publicly cuts AI MLCC prices to win share
The Balance Sheet and Capital Returns: A Structurally Underutilized Lever
The pricing case is half the story. The other half is what Murata does with the cash that piles up. Two charts make the point.
Net Cash Has Compounded for Over a Decade
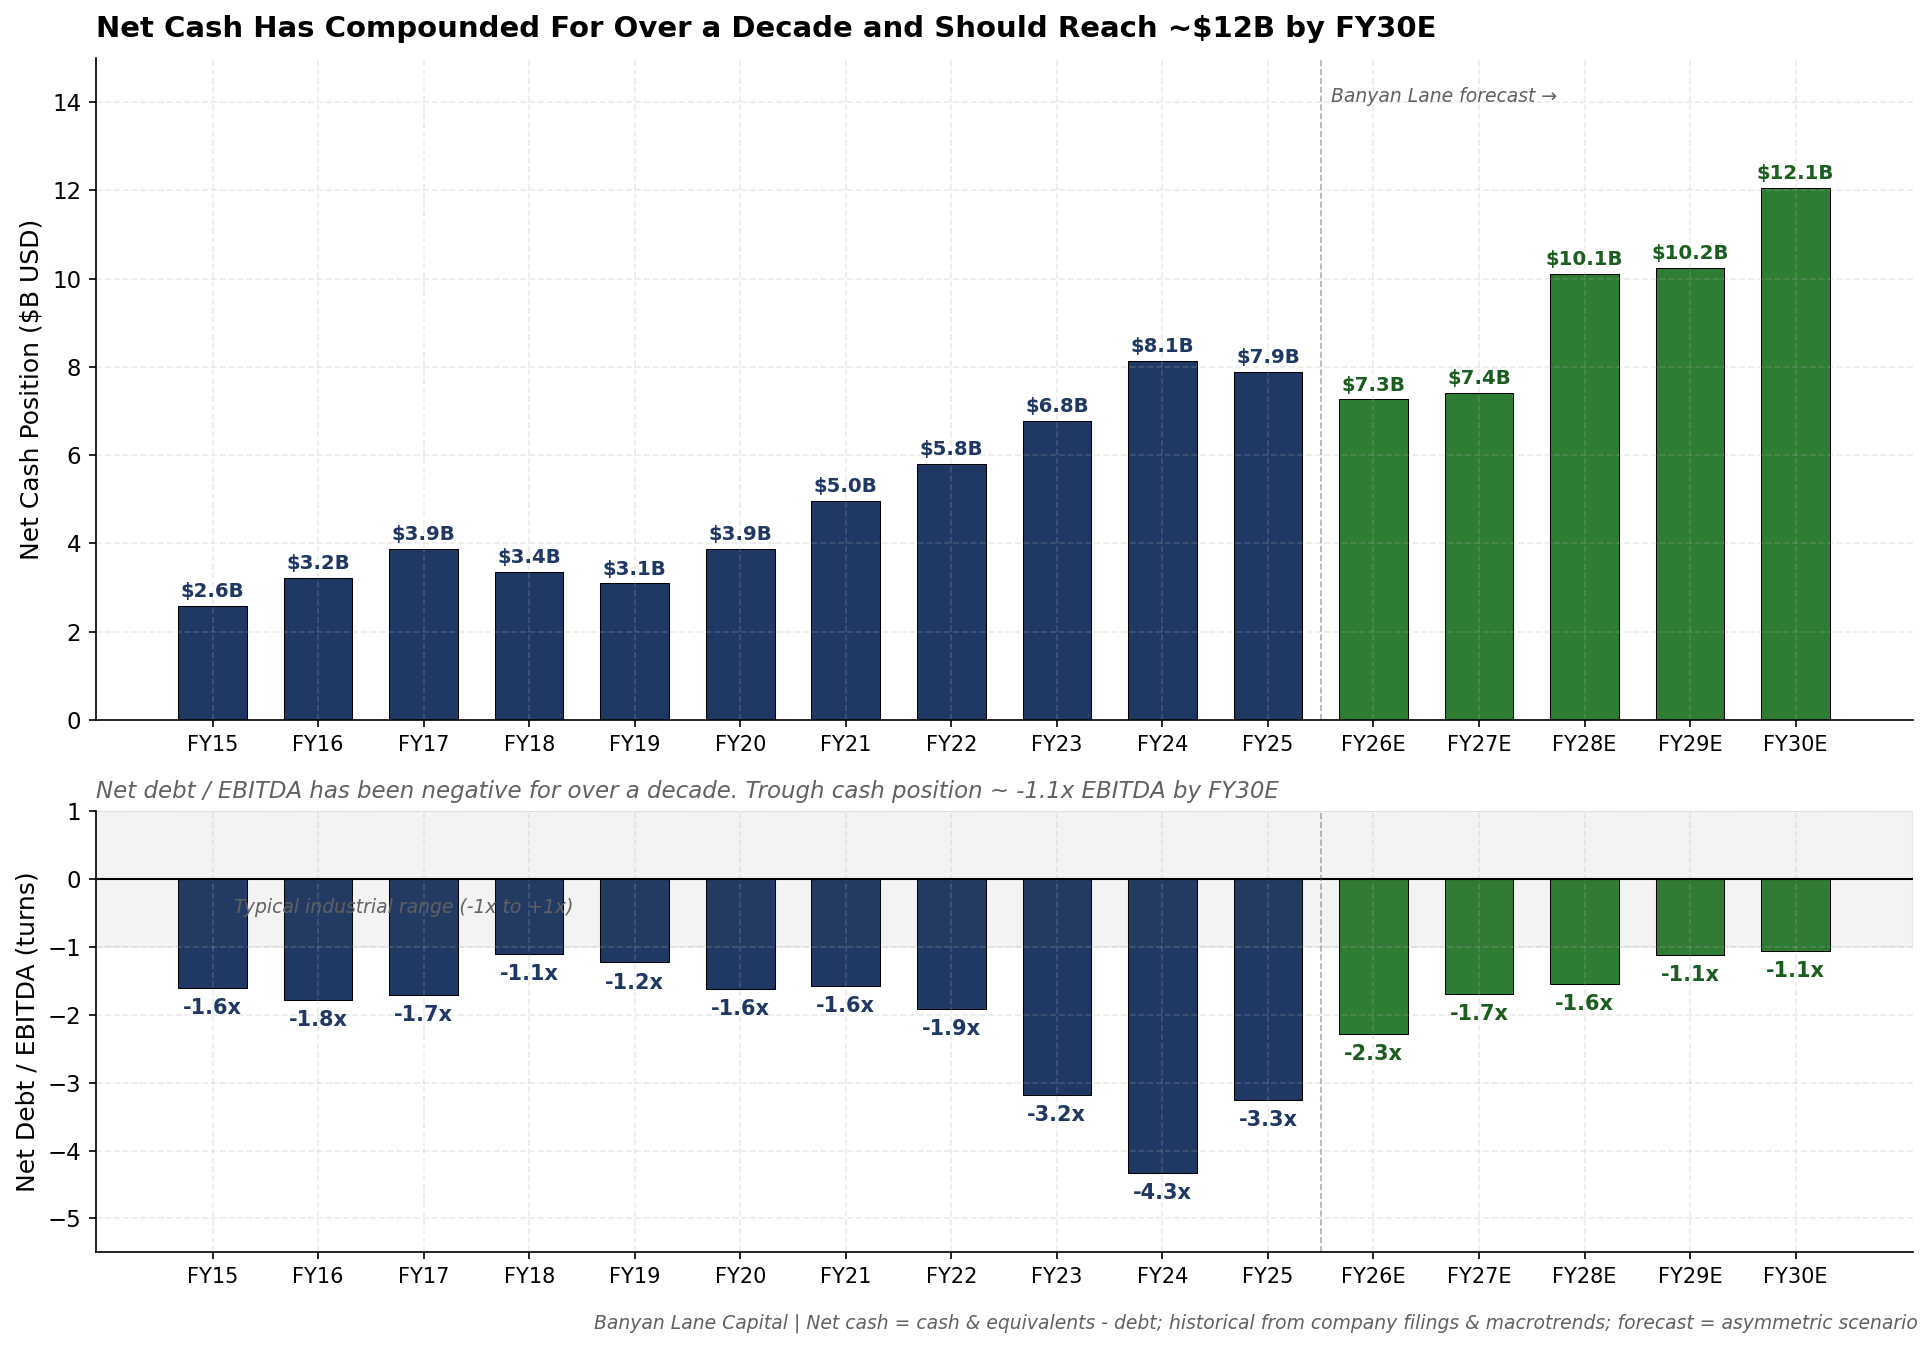
Murata has been in net cash position consistently for 15+ years. Net cash grew from $2.6B in FY15 to $8.1B by FY24 even through one industry cycle and a global financial crisis. Net debt / EBITDA hit -4.3x in FY24, deepest in the company’s history, because cash kept accumulating while EBITDA was at cycle-trough levels.
In the asymmetric forecast case, net cash reaches $12.1B by FY30E even after ¥1,030B of cumulative buybacks (more on that below). Net debt / EBITDA stays at -1.1x even as EBITDA grows 6x from current levels. Even with aggressive capital returns and substantial capex through the cycle, Murata cannot meaningfully spend down their cash position.
This is structurally unusual for a Japanese industrial. A typical company in this category would be 0x to +1x net debt / EBITDA. Murata’s position is roughly 2-3 turns below that range. There is plenty of room to either accelerate capital returns or pursue M&A.
Buybacks Can Run at 2-3% of Market Cap Annually
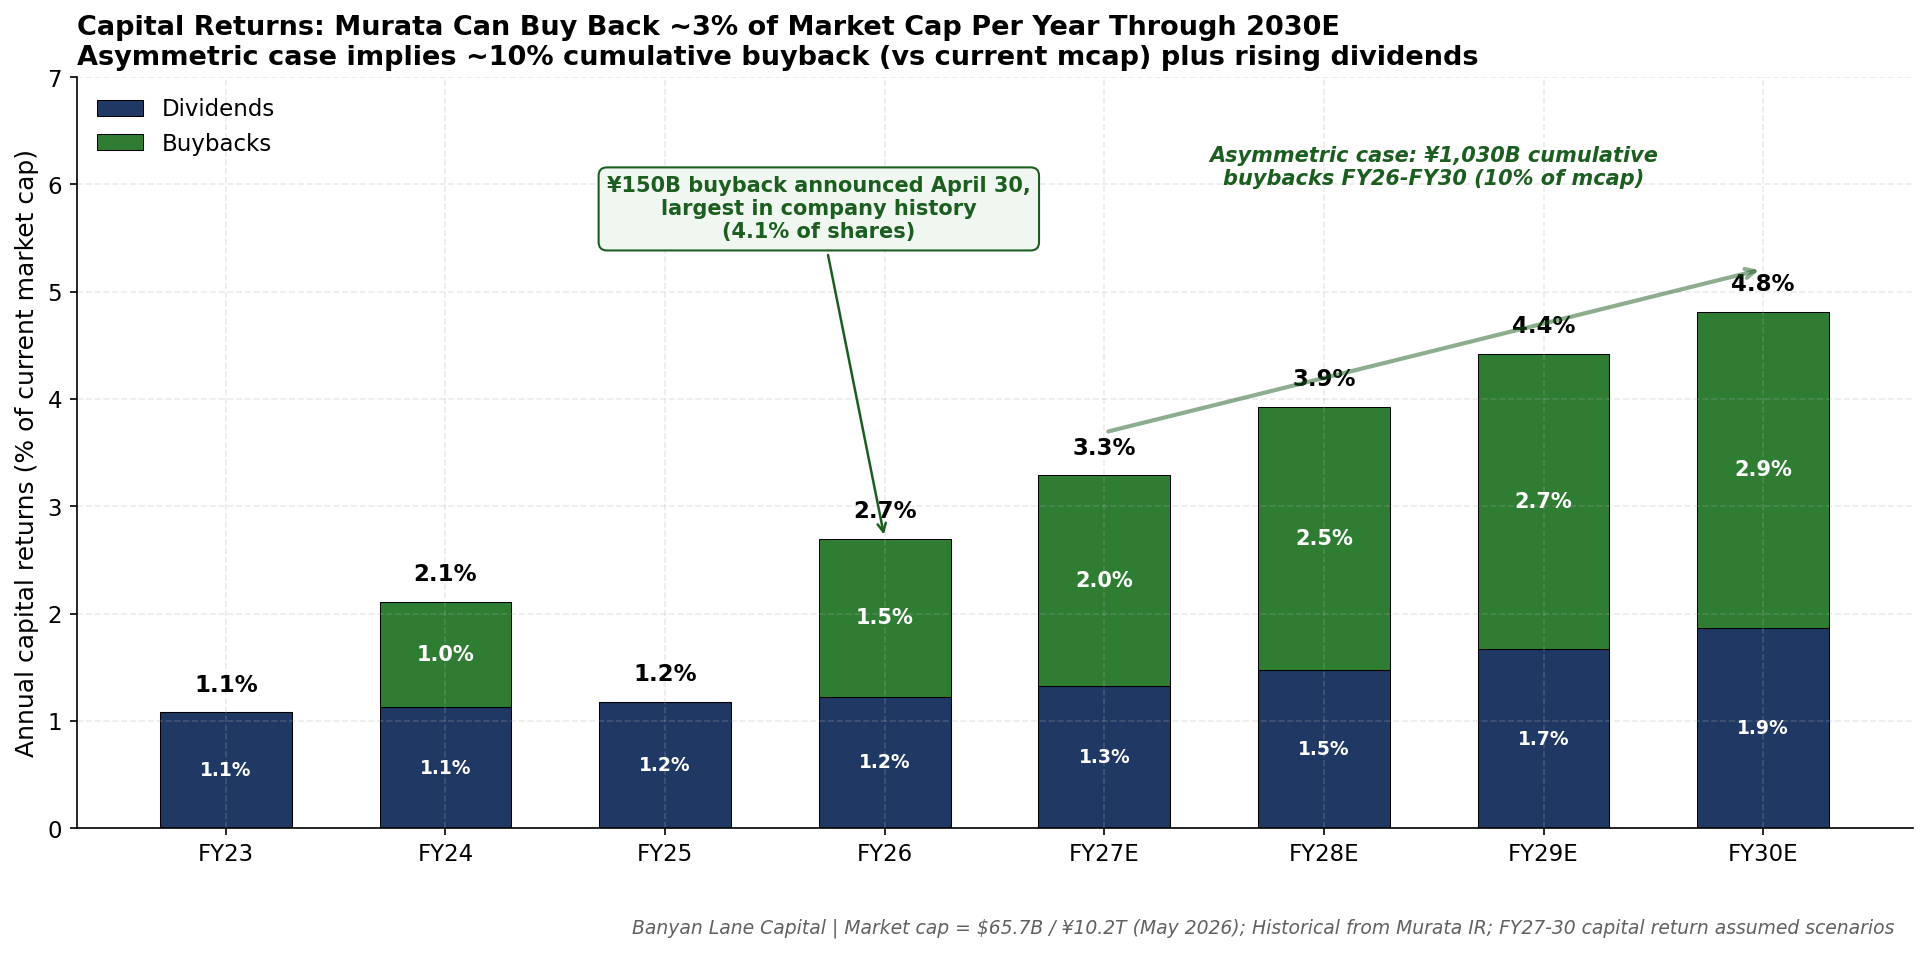
The April 30 buyback announcement (¥150B, the largest in company history, retiring 4.1% of shares) is the start of a meaningful capital return program, not the end. In the asymmetric scenario, we model cumulative buybacks of ¥1,030B from FY26 through FY30, which equals roughly 10% of the current market cap.
Bottom Line
Murata announced ¥80 billion of emergency MLCC capex on April 30, 2026, citing capacity “still very much insufficient” against demand. The bigger update is that the demand picture ties directly to hyperscaler capex now exceeding $700B and heading above $1T by 2027, with Microsoft openly attributing $25B of its 2026 capex to component price inflation. The AI MLCC shortage is structurally larger and longer-duration than 2018, and the supply/demand gap widens through 2030, not closes. Banyan Lane Capital now runs four pricing scenarios based on number of price hike rounds. Base case (4 rounds, FY28E EPS ¥304) gives MRAAY $21.58, +40% upside, +25% IRR. Asymmetric case (7 rounds, extended to FY30E EPS ¥758) gives MRAAY $53.77 on 22x P/E, +249% upside, +43% annualized IRR. Net cash builds to $12B by FY30E even after ¥1,030B (10% of market cap) of cumulative buybacks. Murata has been net cash for 15+ years, with current net debt / EBITDA at -3.3x, and the company has publicly committed to capital efficiency under Medium-Term Direction 2027. This is not a compounder story. It is an extreme supply/demand cycle with a disciplined capital allocator at the center. The thesis got stronger this week, not weaker.