


This work is in part inspired by Bristlemoon Capital’s July piece on incremental ROIC (worth a read link). I have used incremental returns and margins many times in the past, and believe it to be generally underused. The other inspiration is my general love of deep granular modeling of dynamic systems. In a past life, I covered oil & gas globally and ran the global supply and demand models for the energy fund I worked at. This included monthly, country-by-country builds (for those that mattered) and aggregated all production from any E&P or major that was public - from US E&Ps modeled individually against varied oil price forecasts to aggregate Egyptian production based on how many wells APA and others would drill. Suffice to say, I developed a fondness of gritty details in a spreadsheet and building insights from that actually mattered. I was once told meeting by Goldman’s commodities that our meetings were their favorite because we had intel to and edge to make for a balanced conversation.
Moving onto GOOGL… I’ll admit upfront I spent a great deal of time attempting a bottoms-up build. It failed. However, some of the insights do provide value in mapping the path forward for one of the largest CapEx spenders, globally, in history. I found half to 2/3 of the GW they’ve planned depending on the year.
GOOGL does not disclose MW by site, and expansion inside an already-powered campus generates no groundbreaking or press release. The company discloses $85.2BN of leases signed but not yet commenced with no counterparty named. Twelve countries of international buildout publish almost no capacity figures at all.
The verdict. Google Cloud is becoming the majority of Alphabet’s earnings power. This capacity it is being built and deployed into the tightest compute market, and roughly 3/4 of that capacity has no price attached to it yet (best we can tell). You cannot model the outcome with precision. So I created a range of outcomes and mapped them to FCF in 2030. Ultimately, this is what the market cares most about. After the years of massive spend, will investors get FCF back on the balance sheet to do something with.
The TLDR… pay attention to compute contract pricing going forward. If the current path continues, Alphabet could see 25%+ upside to 2030 FCF estimates and trade at the high end of its historical P/FCF range at 30x.
1. The monster
Start with what has already happened, because the change in this business is easy to miss if you follow the consolidated line.
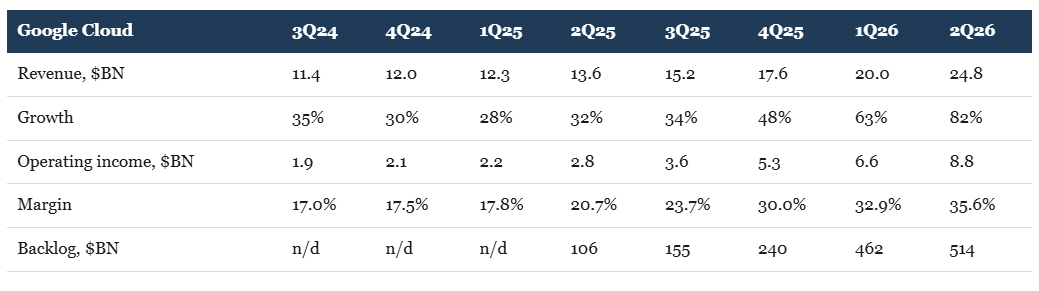
Revenue growth accelerated significantly and operating margin doubled. Backlog went up 4.8x in twelve months, much faster than revenue growth. Q2’s incremental margin was 54%.
Cloud contributed 5% of operating income in 2024 and 11% in 2025. Our base case models 18% this year, 30% next, and just under half by 2030.
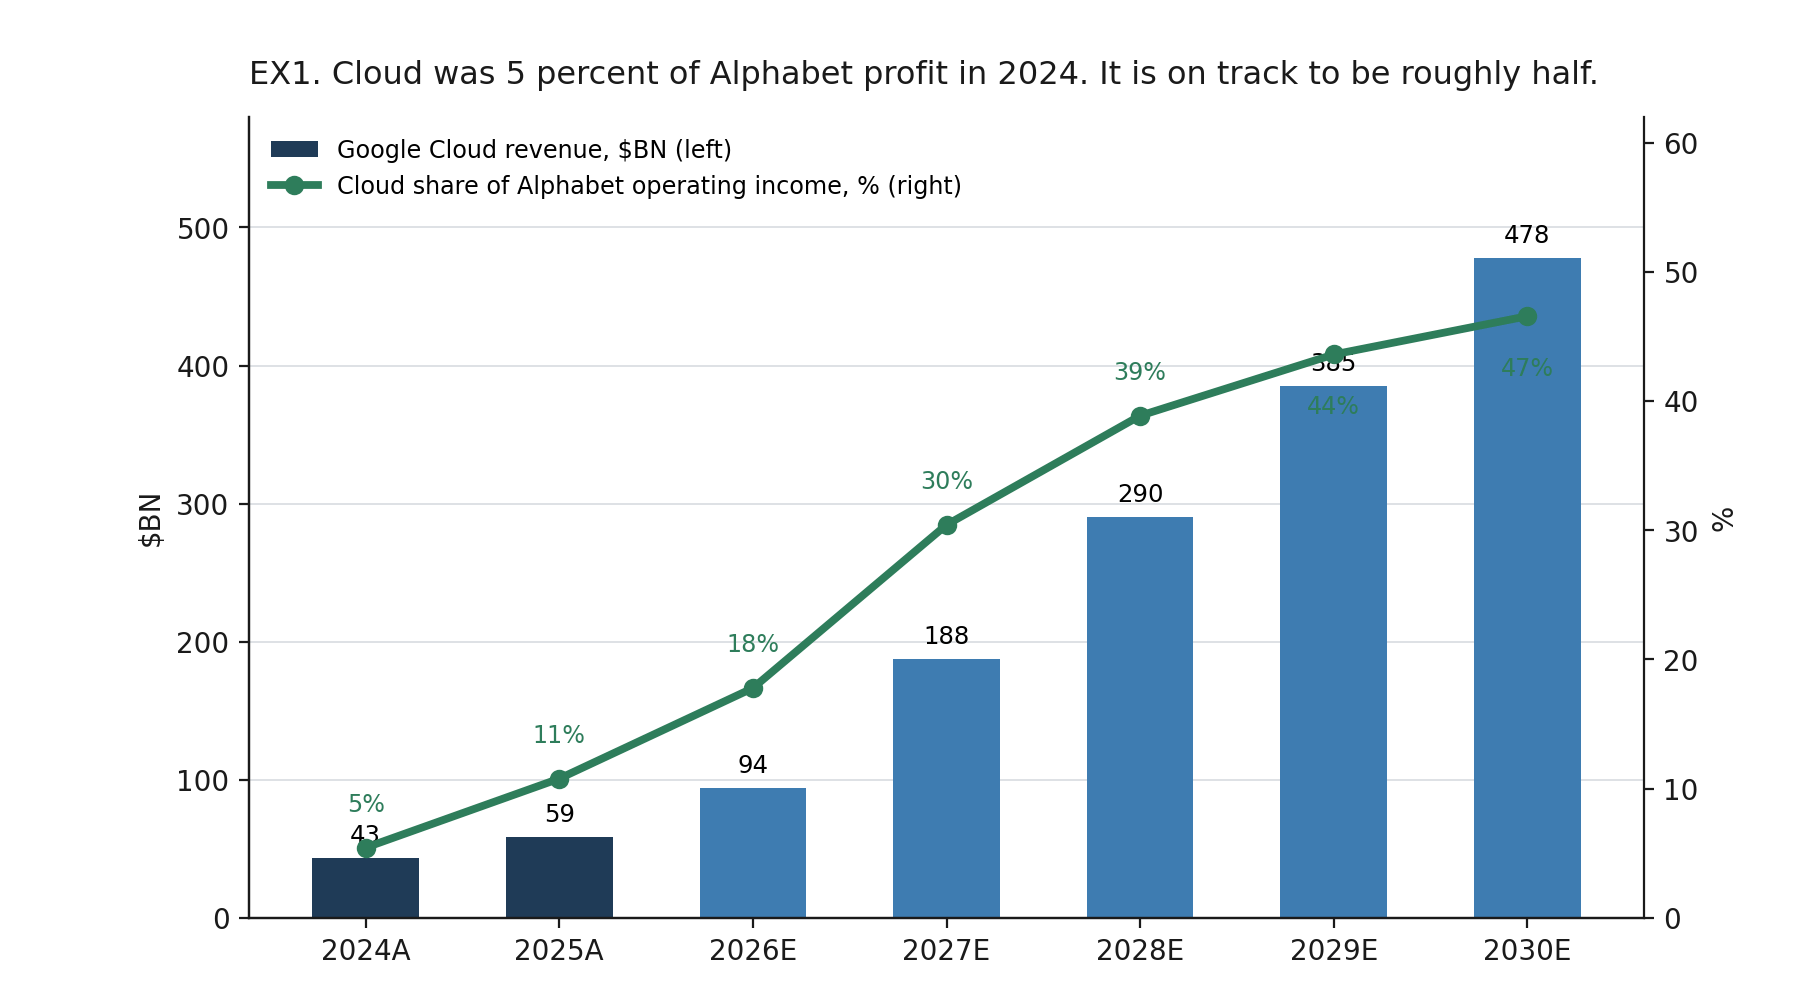
This is the part that matters for the stock. Alphabet spent two decades as an asset light advertising behemoth with a rounding error attached and that will now begin inverting… the compute business is growing at 3-5x the rate of the advertising business.
FCF was -$5.9BN in the second quarter, the first negative quarter Alphabet has ever printed. Capex guidance has been raised three times this year to $195BN to $205BN. Buybacks went to zero for the first time in a decade and the company raised $49.6BN of equity in June.
2. Data center unit economics
A gigawatt of compute capacity behaves like a well with a fixed production profile. You spend the shell cost roughly a year ahead of the servers. You spend the server cost in the year the capacity lights. Then it produces for about six years until the chips are retired and the building is re-racked.
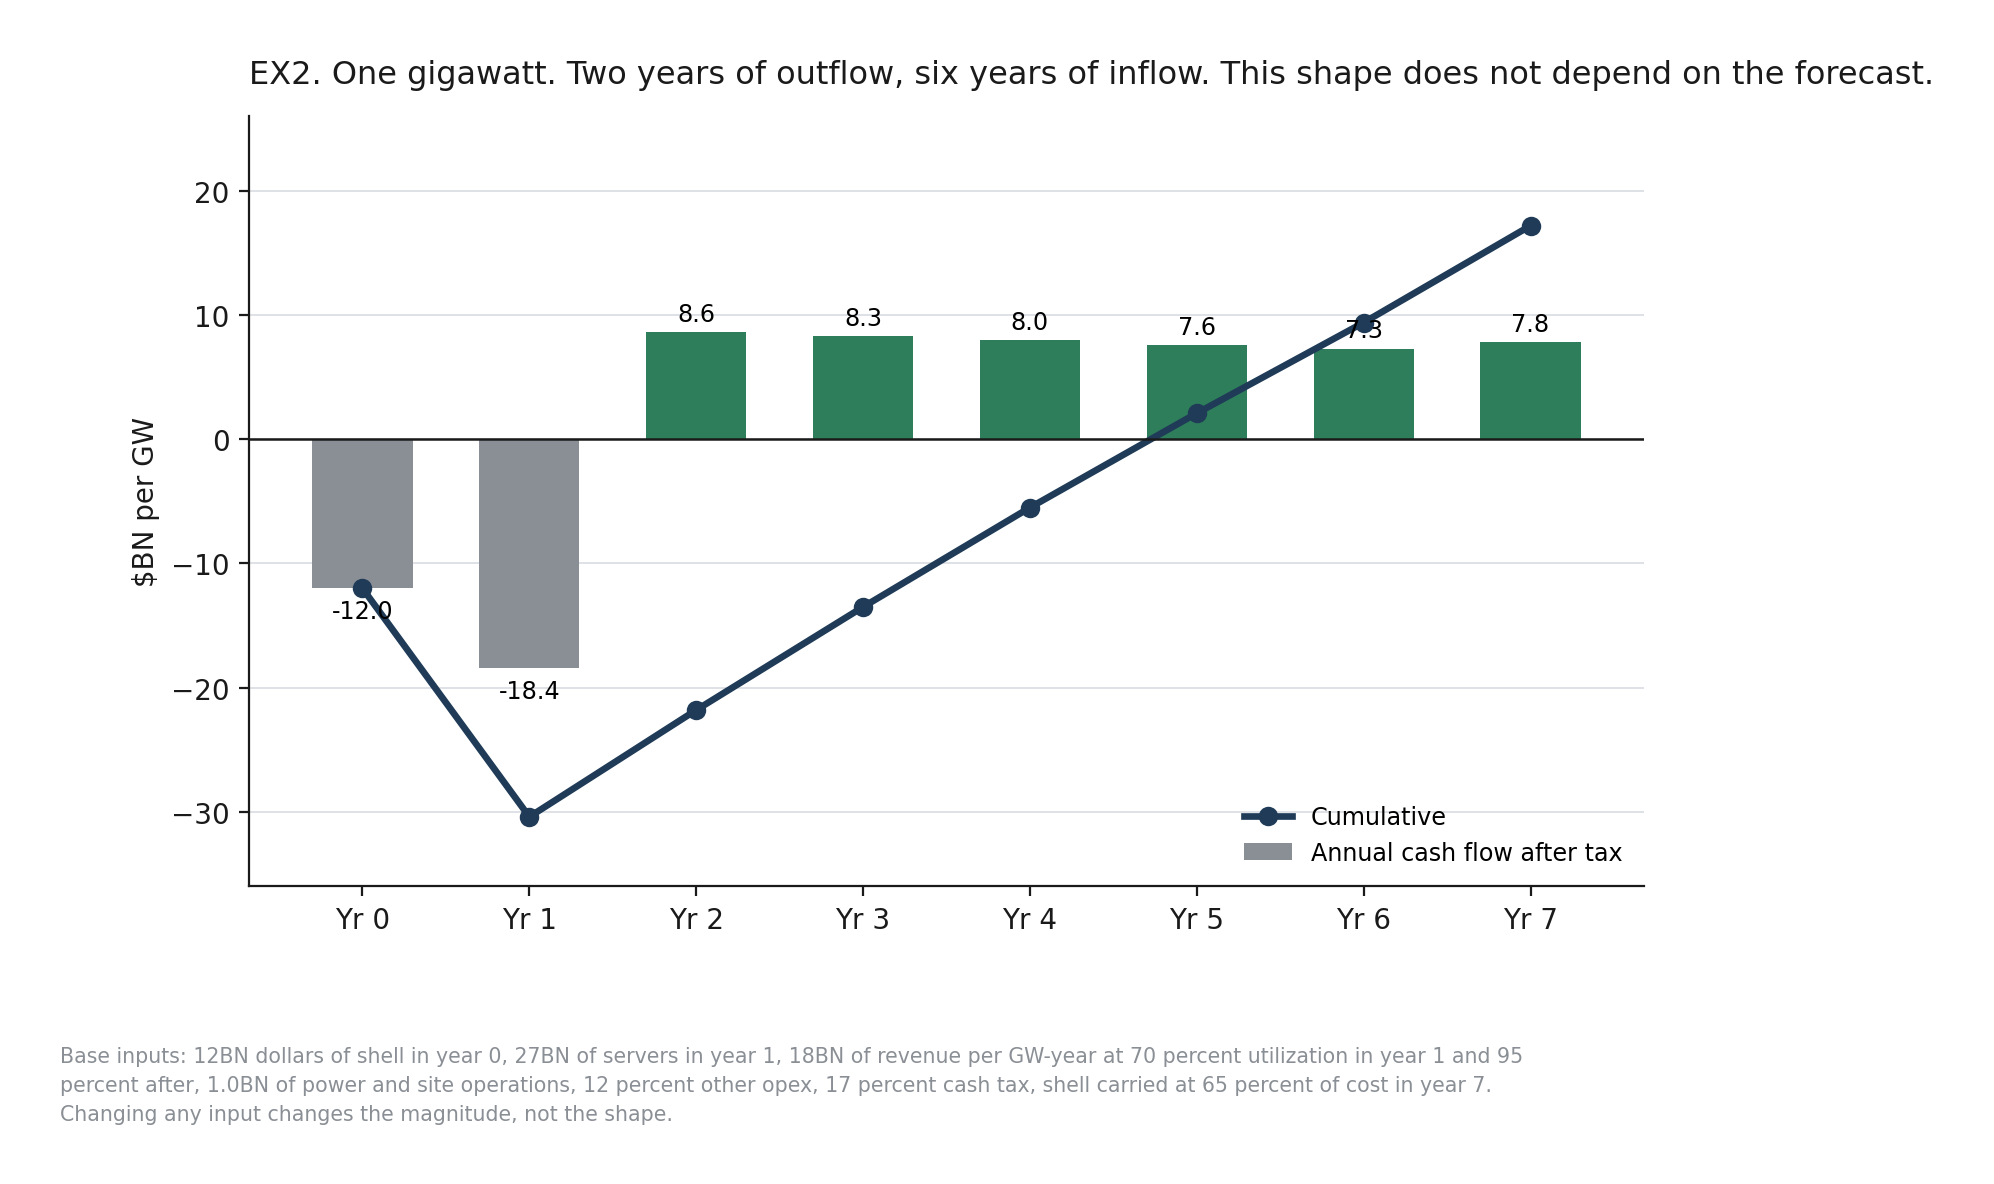
Two years of outflow, six years of inflow. On our base inputs, one gigawatt costs about $39bn for GOOGL and returns about 1.5x that after tax over one server cycle, with a payback in year five.
Now stack them. Build one gigawatt this year, more next year, more the year after.
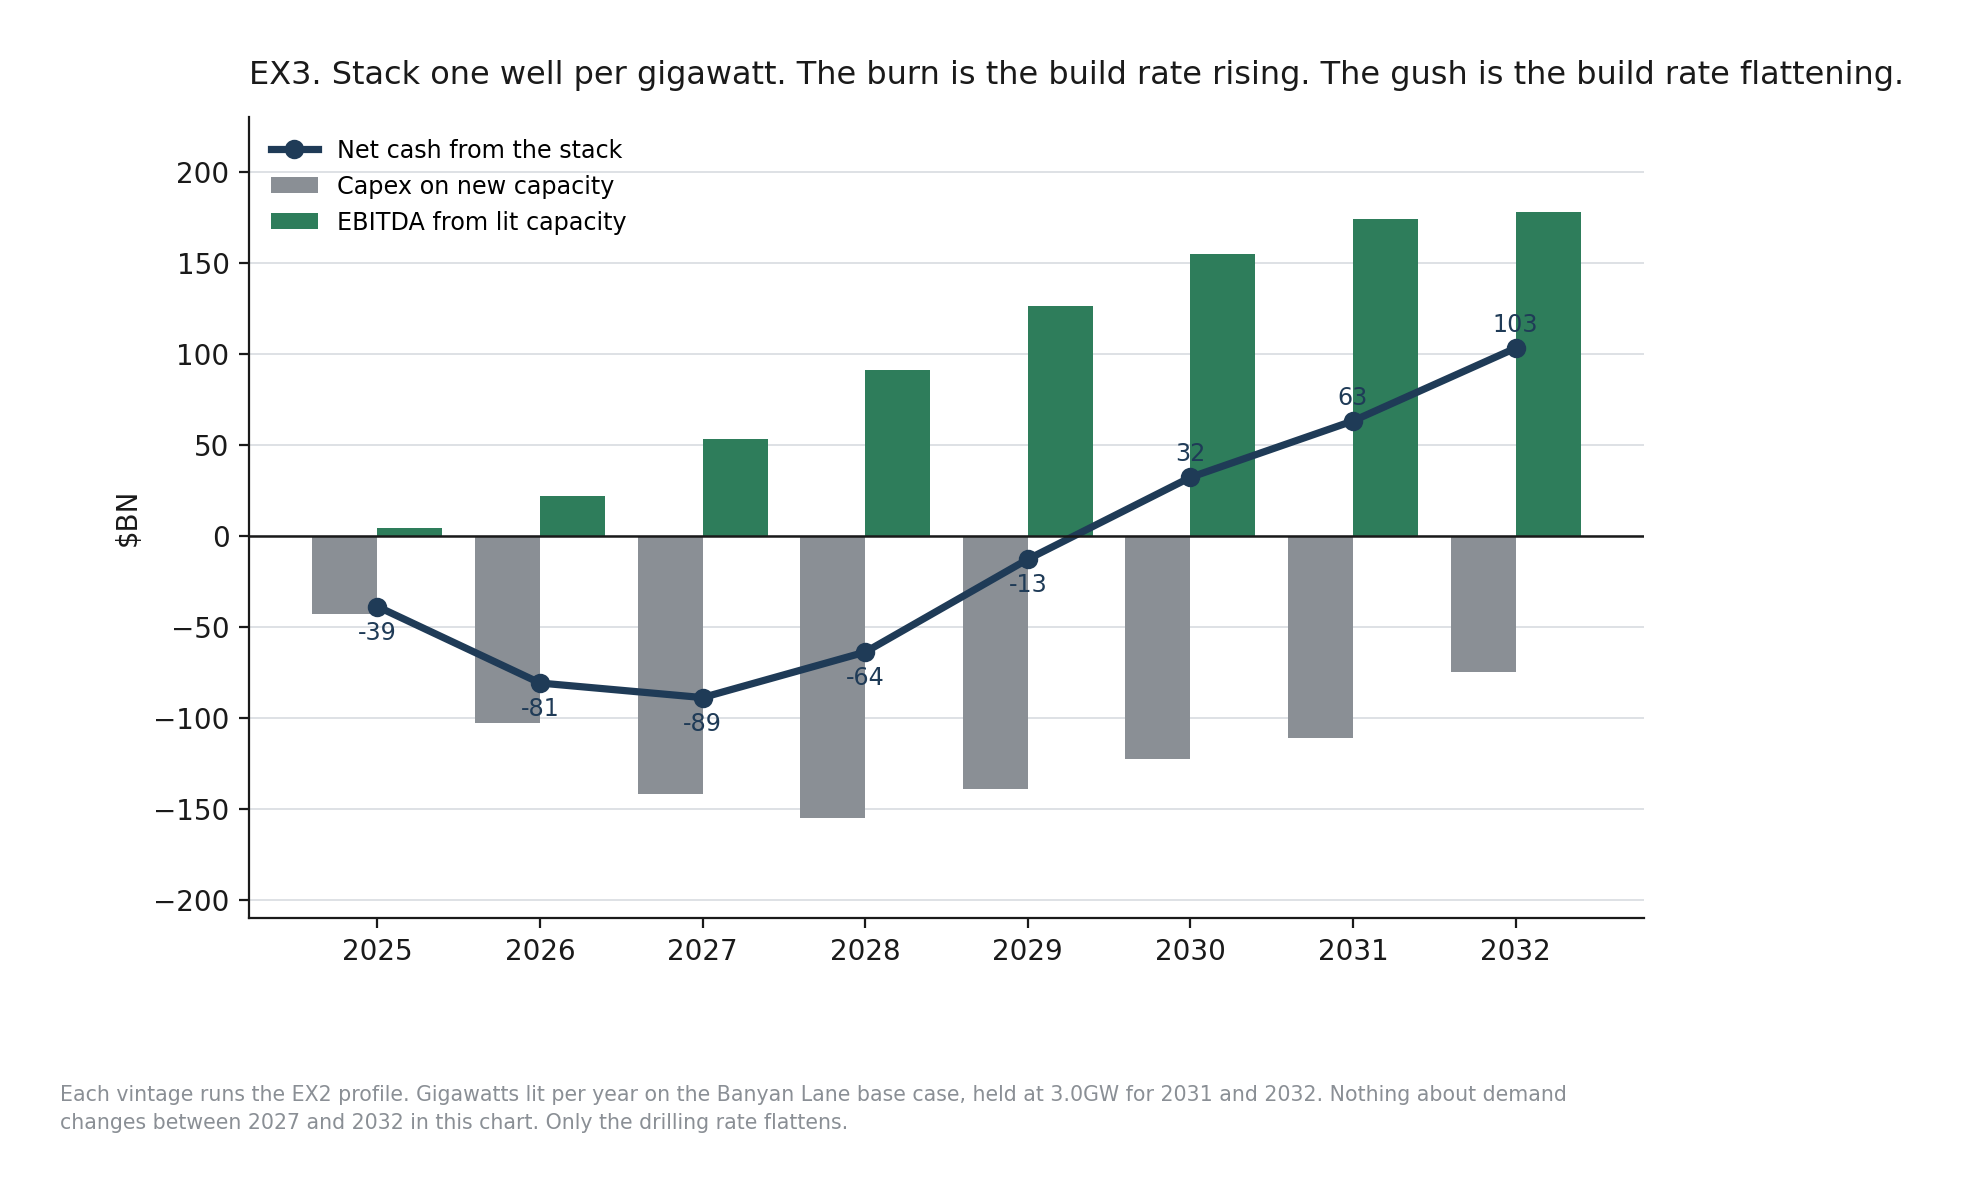
While the build rate is rising, cash burn accelerates while the model waits for capacity to be fully utilized. The moment the build rate stops rising, the accumulated production overwhelms the current spending.
This is why Alphabet’s cash flow statement looks the way it does, and it is the single most important thing to understand about the name. The burn is not evidence of a problem, at least as far as anyone can reasonably tell today given the demand outlook. The burn is arithmetically what a company looks like when it is adding capacity faster each year than the year before. The question is not whether the flip happens, but how big the number is on the other side, and when.
3. What we could not find
Here is the honest accounting of the mapping exercise.
Take Alphabet’s capex, strip out the ~8% that is offices, split the rest 60/40 between servers and buildings the way management has described it consistently since late 2025, divide by a cost per gigawatt, and phase it into service. That is the top-down count, and it says Alphabet turns on ~1.9 GW this year, 3.8 next year and 5.4 in 2028 after applying a six-month delivery delay.
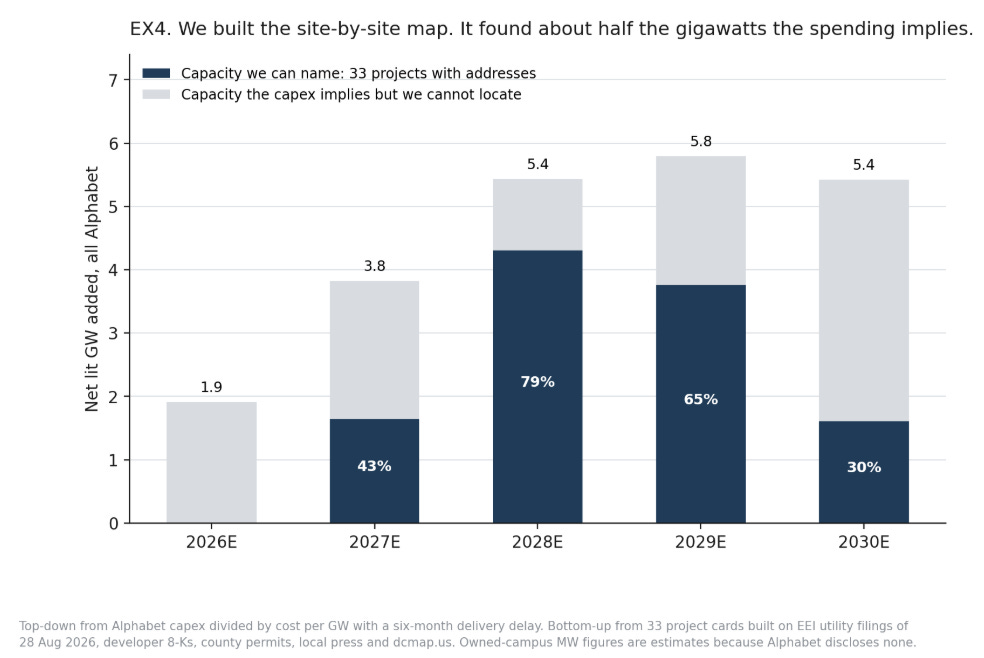
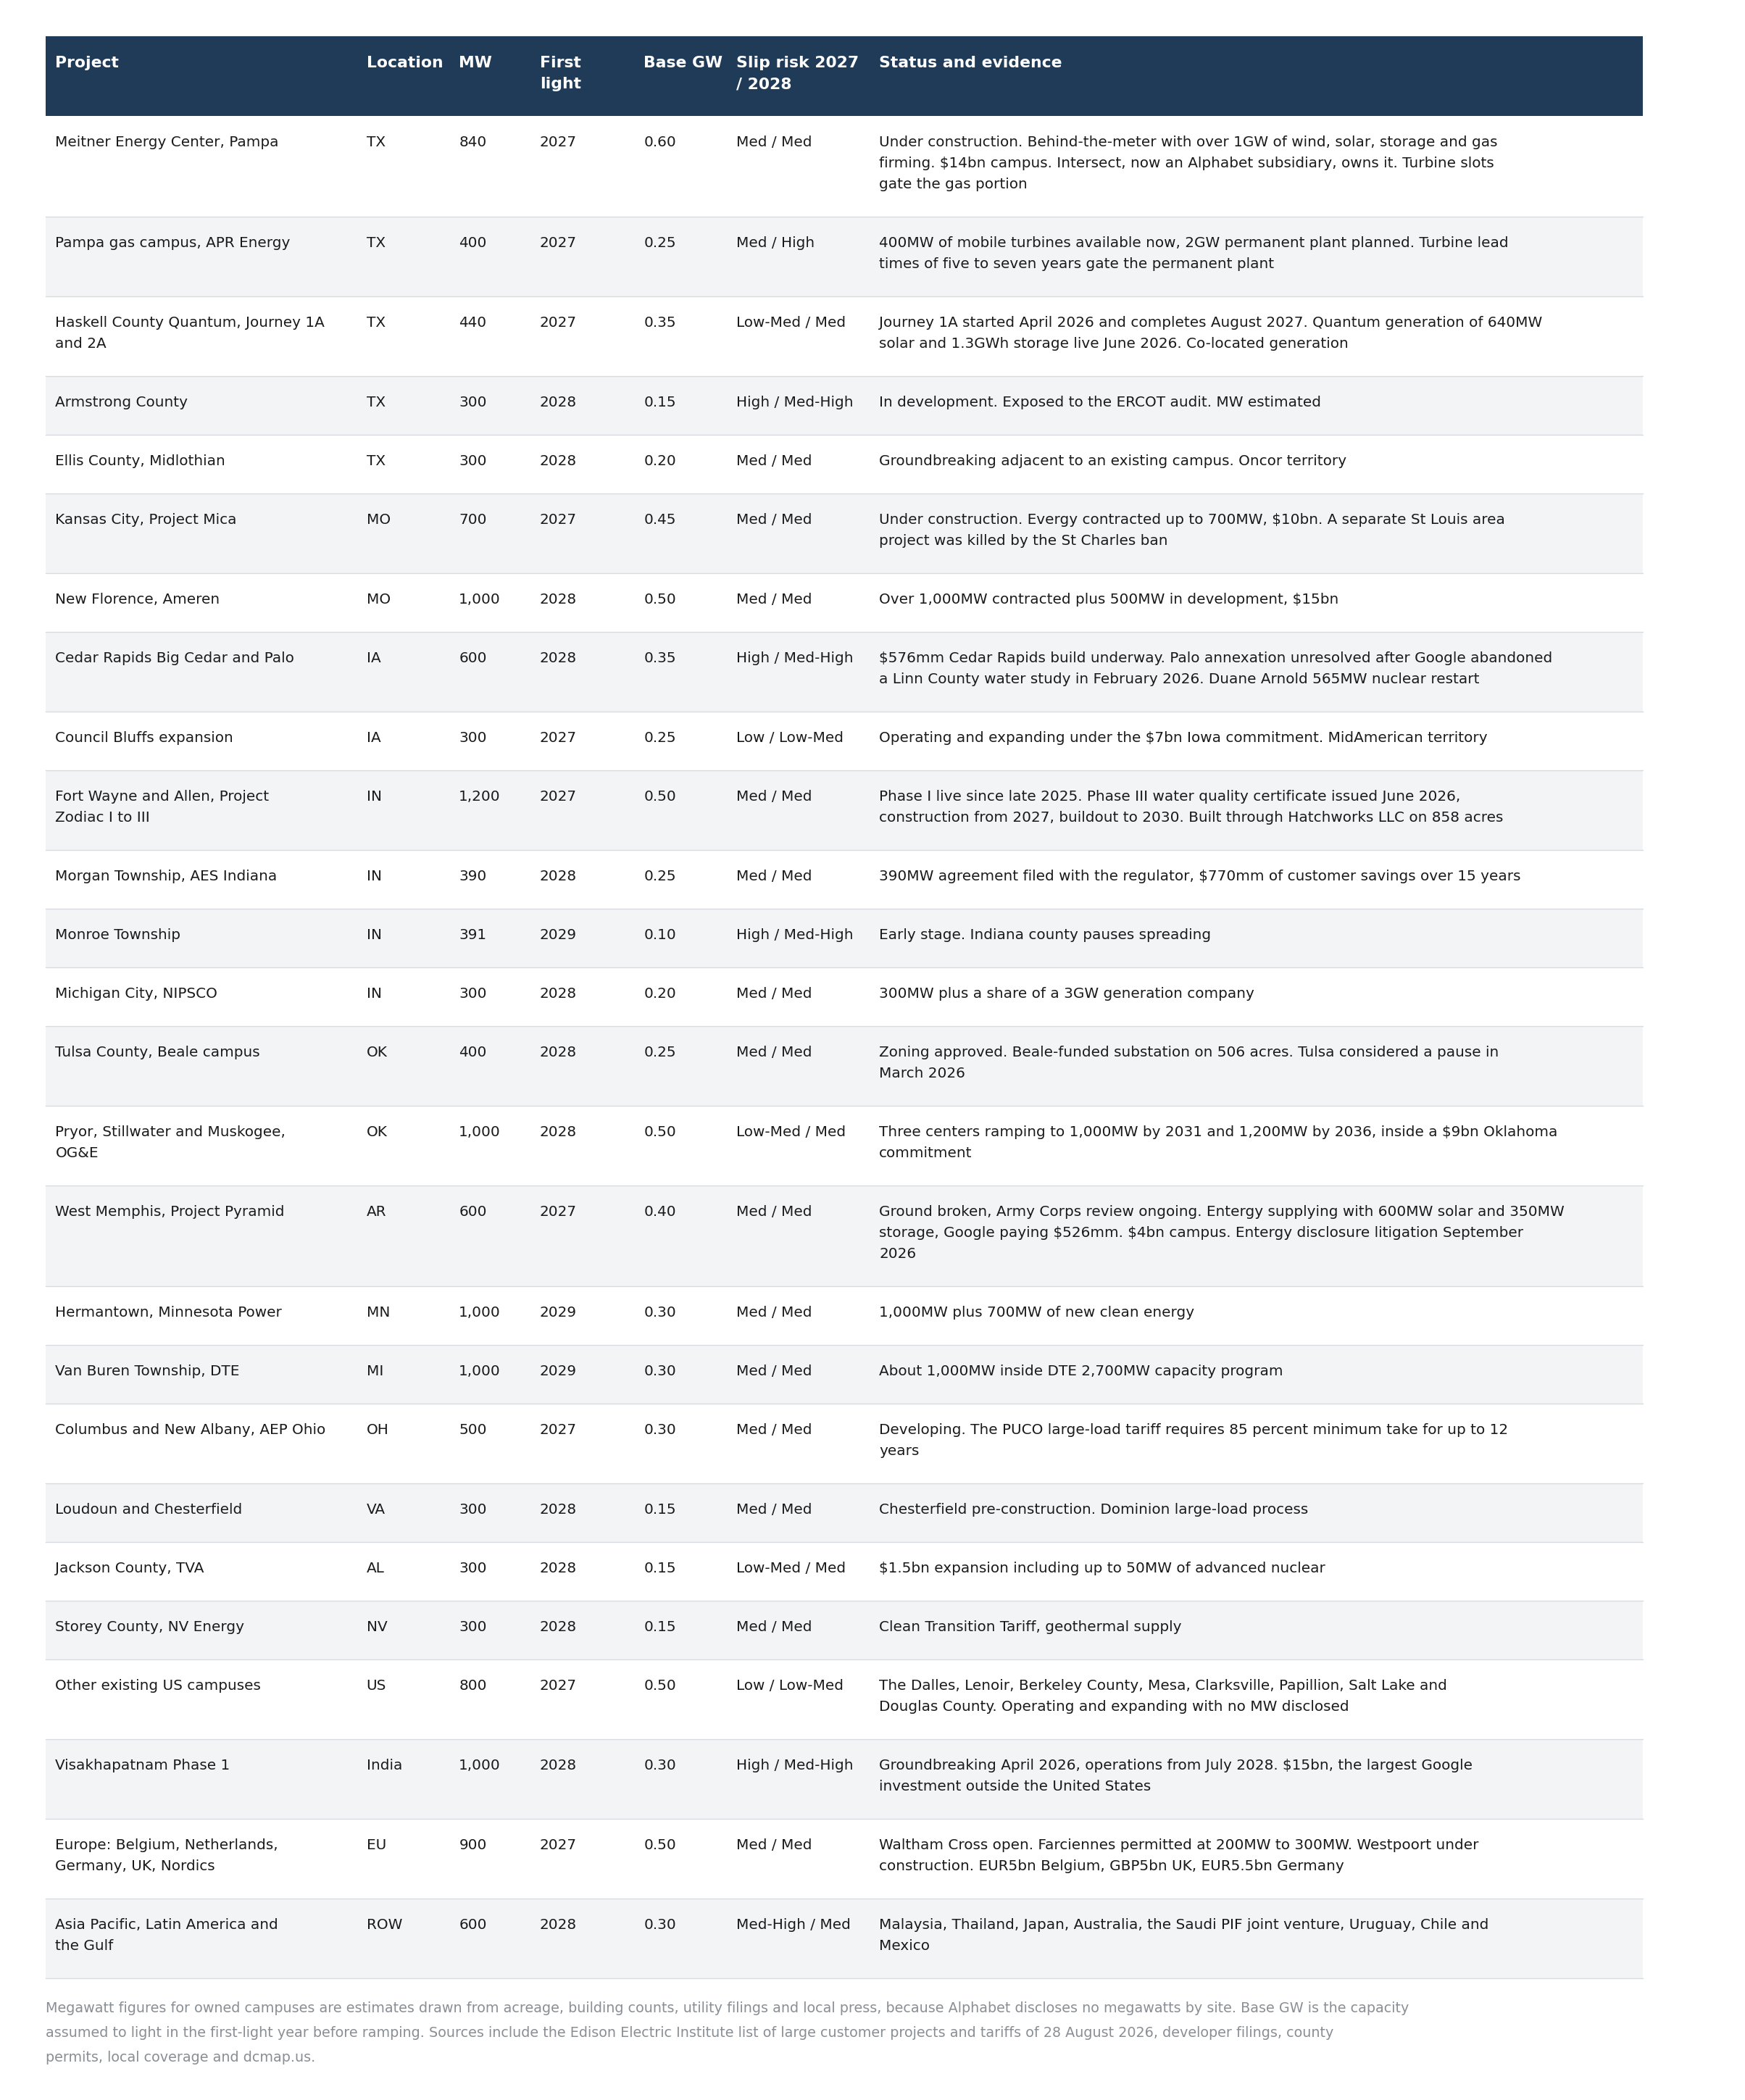
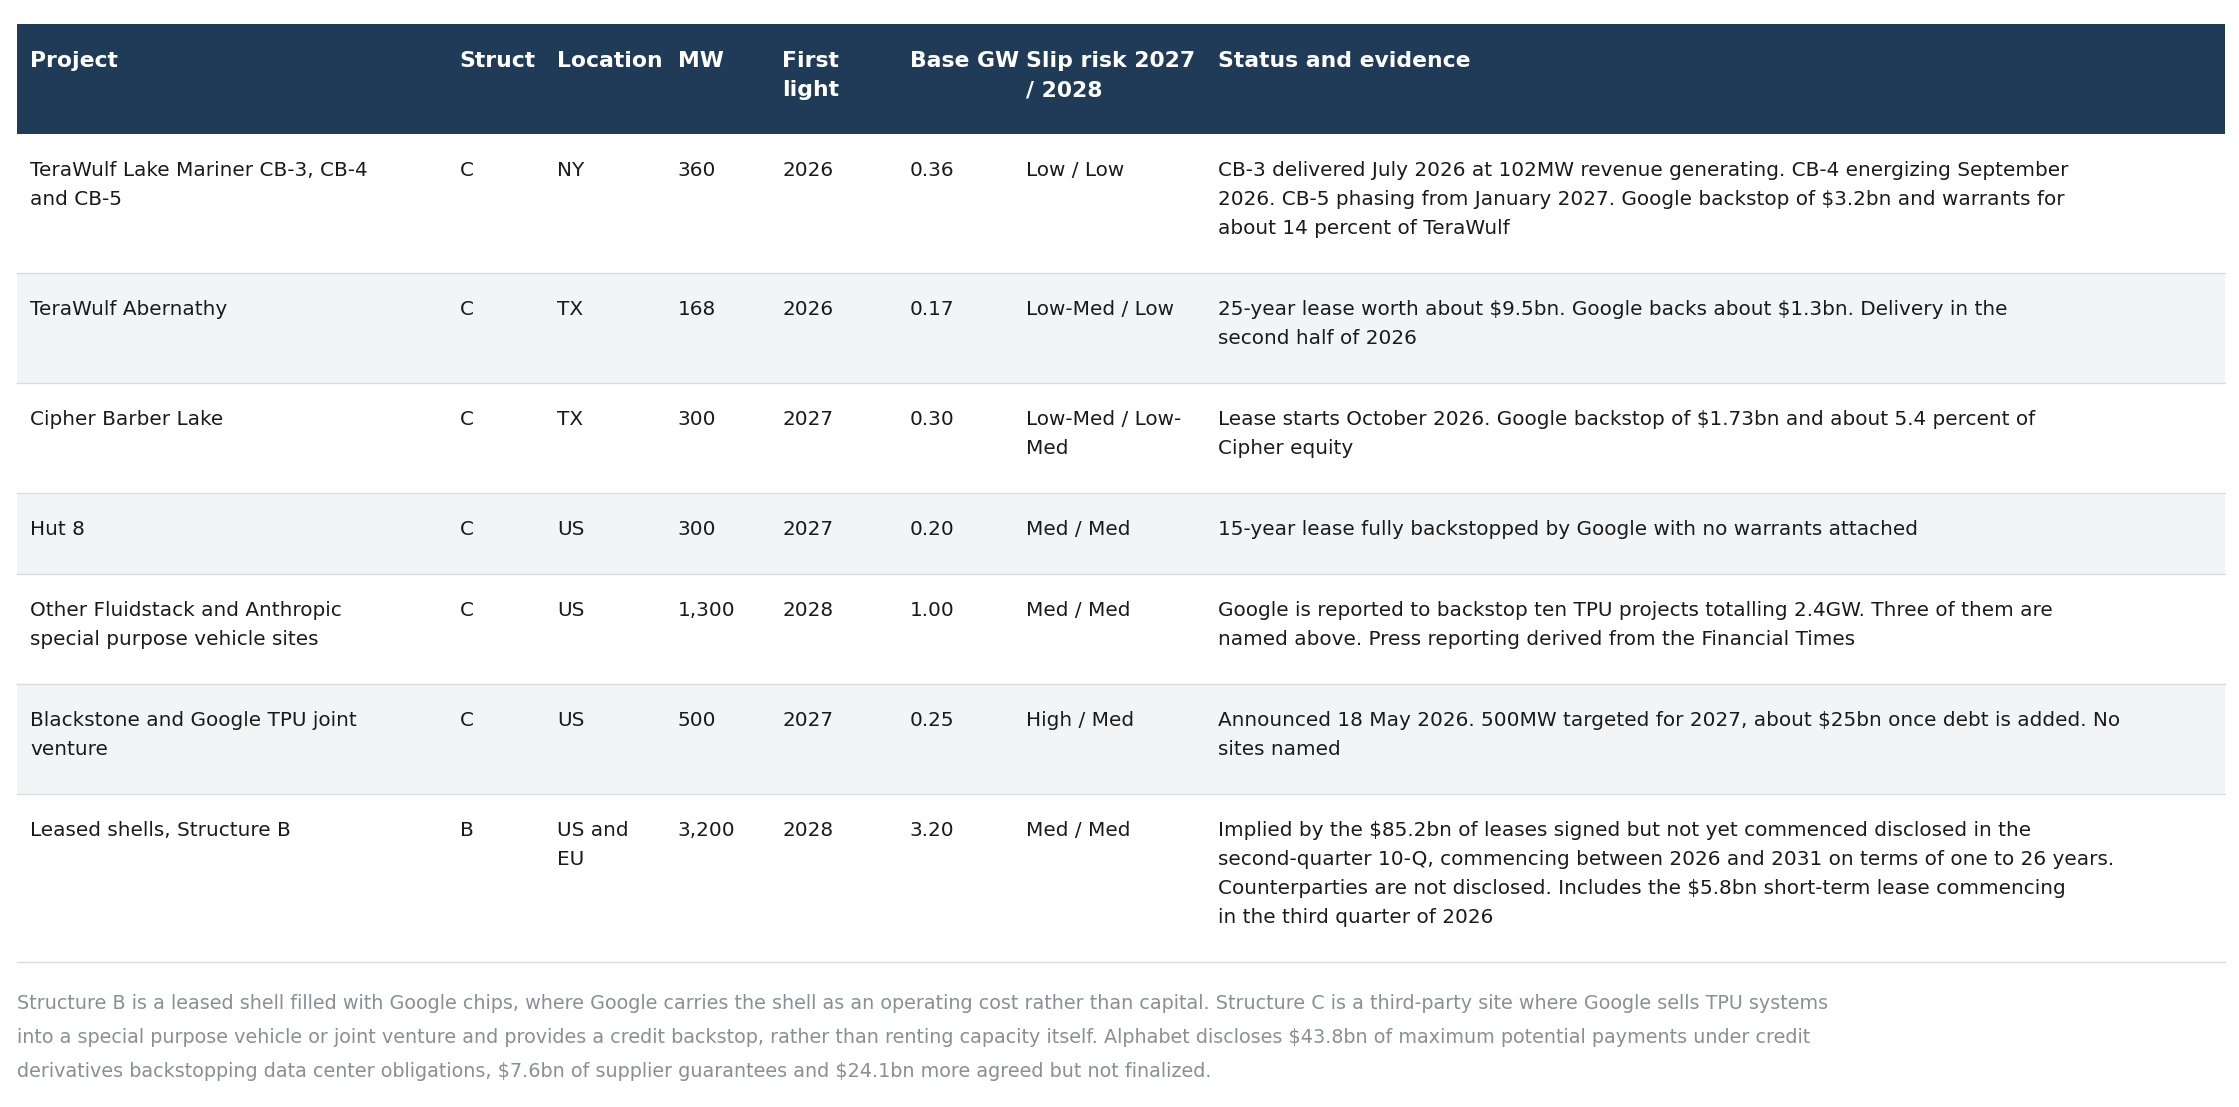
The register covers 43% of 2027 and 79% of 2028, and roughly half of the five-year total. The single cleanest illustration of why is Anthropic. Broadcom’s filings put roughly 3.5GW of next-generation TPU capacity for Anthropic beginning in 2027, and on the Q2 call Broadcom said Anthropic is on track to become its largest custom accelerator customer next year, ahead of Google itself. Press reporting derived from the Financial Times says Google backstops 10 TPU data center projects totaling 2.4 GW. We have addresses for three of them.
Five things remained unmapped. Expansion inside existing campuses, which could be the largest figure and which generates no public record at all beyond the occasional utility filing. The $85.2BN of leases not yet commenced, which is a disclosed number attached to no disclosed tenant, implying roughly 3.2GW of leased shell. International capacity across twelve countries where megawatts are almost never published. Densification, because an Ironwood rack draws far more per square foot than the rack it replaces. And the unnamed Anthropic sites.
One honest counterweight. Some of the gap is our top-down being generous rather than the bottom-up being sparse. Alphabet’s capex includes turbine deposits, transformer prepayments, land and Broadcom supply commitments that will not light anything for years. Inventory went from $2.4BN to $10.0BN in six months, and TPUs built for sale to third parties are not Google’s own capacity.
And the timing is uncertain even for the buildings we can name.
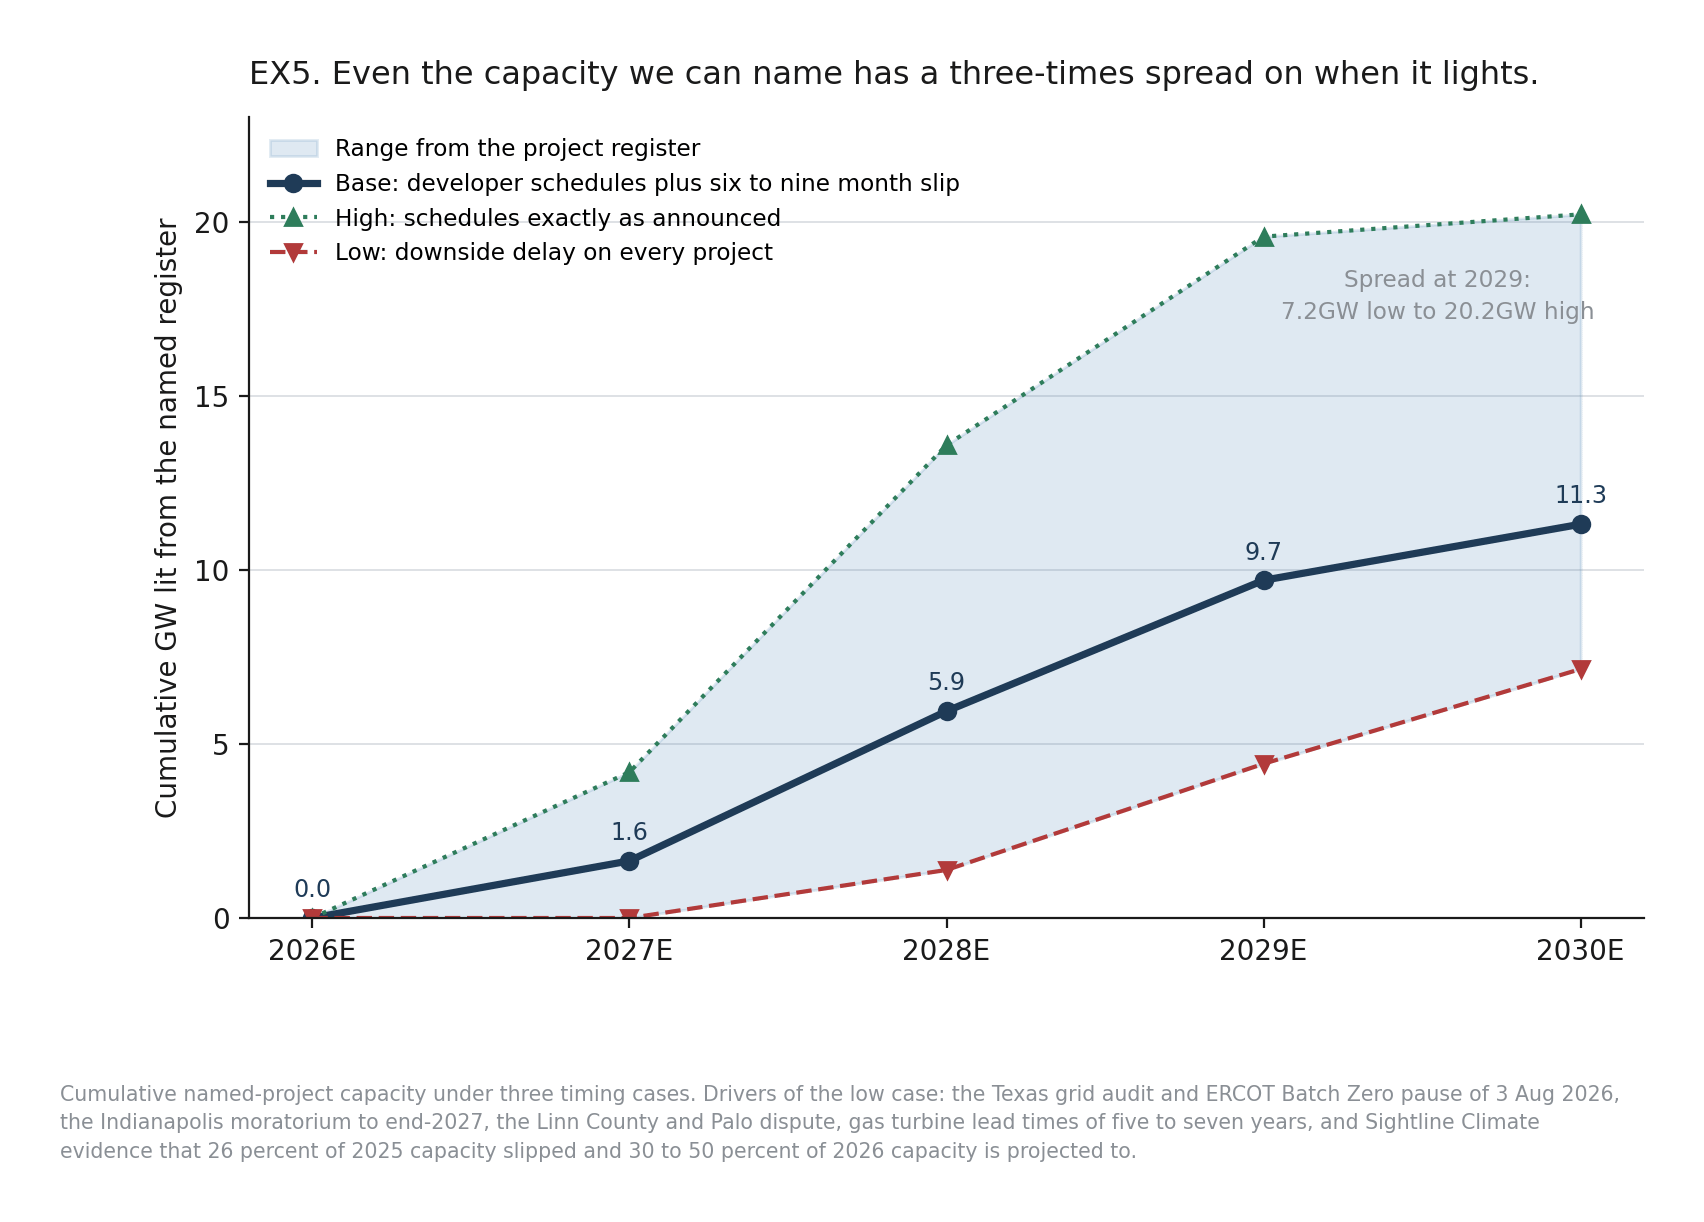
That is a 3x spread on cumulative named capacity by 2029, using the same set of projects. Texas ordered a full audit of every data center in the ERCOT interconnection queue early August and suspended large load classification, with completion targeted for December. Indianapolis has a moratorium through the end of 2027. St. Charles passed a permanent ban. Pennsylvania removed data centers from fast-track permitting. Gas turbine lead times run 5-7years, and GE Vernova’s book is sold out into 2030. Sightline Climate found that 26% of expected 2025 capacity slipped and projects 30-50% of 2026 capacity will.
We handle this by carrying capex in full in every scenario and pushing half of each year’s newly lit capacity into the following year. If Alphabet delivers on schedule our capacity is too low and our cash flows are too low. If it slips, we have already paid for it.
4. Pricing
I spent much of my effort on the physical build and it was the wrong place to spend it.
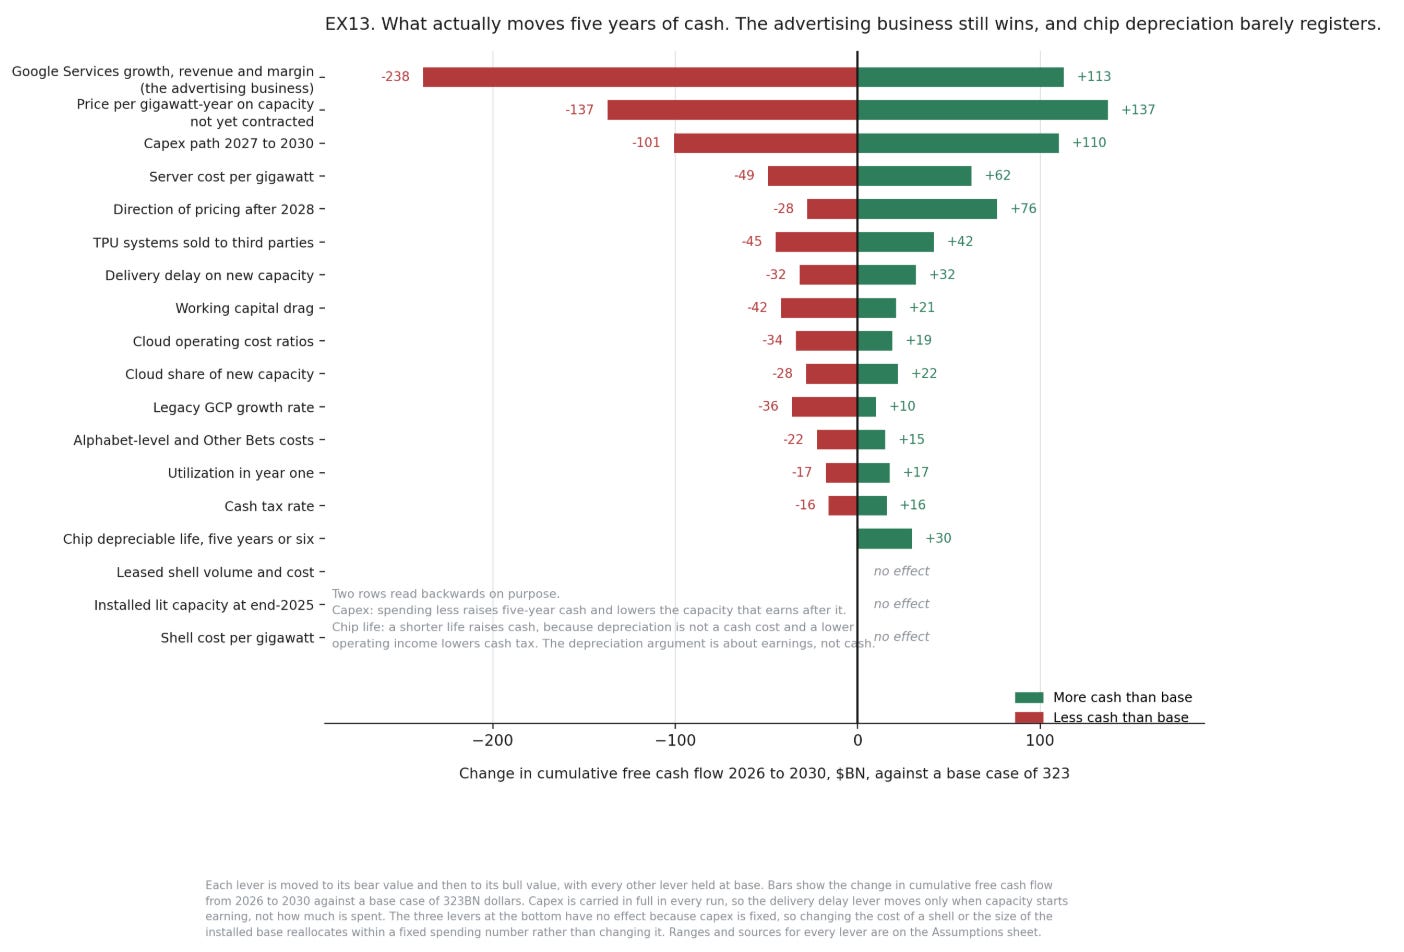
Run the model changing one lever at a time and measure the effect on five years of cumulative free cash flow. Delivery timing, the thing the entire site-by-site exercise was built to pin down, is worth +/- $32bn. The price of a gigawatt-year of compute is worth $137bn either way.
Pricing matters 4x more than the construction schedule. So we went and built the pricing comps properly, across every deal with disclosed dollars and disclosed capacity.
The first thing to understand is that there are three different things being sold and they differ by a factor of thirty.
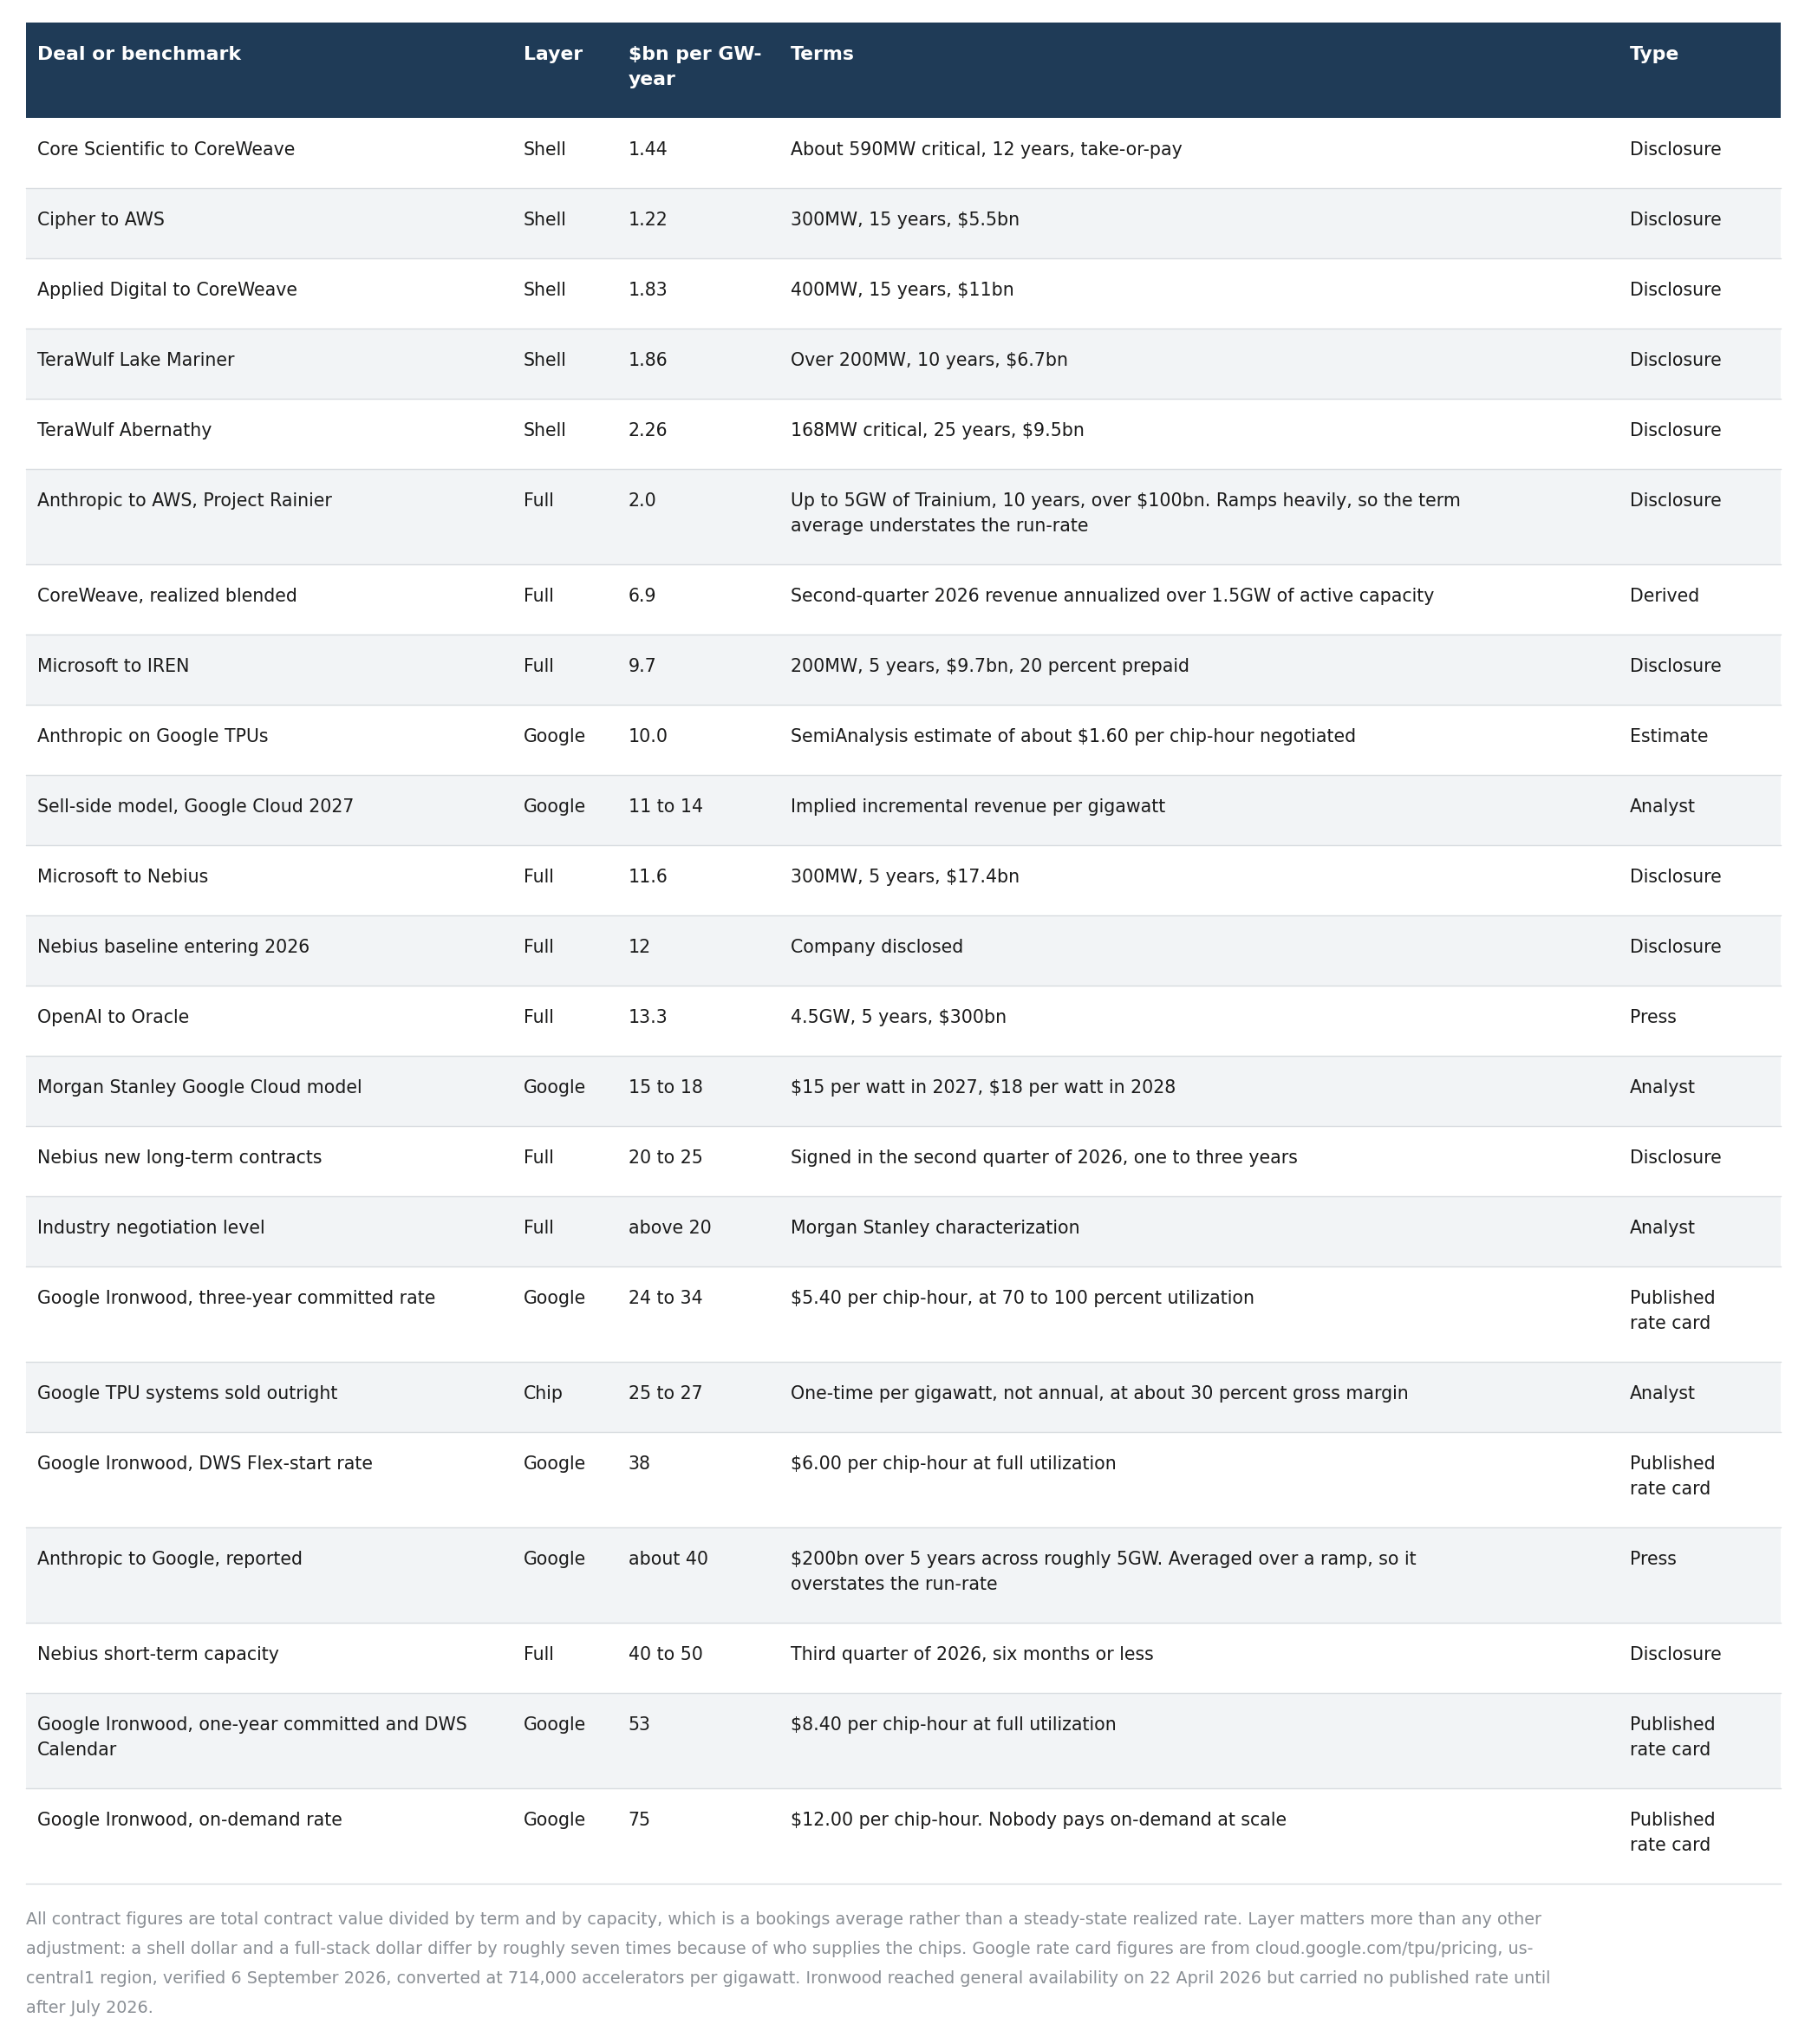
A powered shell lease is a building with electricity and cooling in it and nothing else. The tenant brings the chips. Core Scientific leases to CoreWeave at roughly $1.44mm per megawatt-year. Applied Digital is at $1.67mm to $1.83mm, Cipher at $1.22mm to $1.79mm, TeraWulf at $1.86mm to $2.26mm. Call it $1.2bn to $2.3bn per gigawatt-year for real estate with power.
Full stack compute is the same building with the operator’s chips in it. CoreWeave’s second quarter revenue against 1.5GW of active capacity annualizes to roughly $6.9bn per gigawatt-year blended across its fleet. Microsoft’s contract with IREN is $9.7bn over five years for 200 MW, or $9.7bn per GW year. Microsoft with Nebius is $11.6bn. Nebius disclosed its own baseline entering 2026 at about $12bn.
The gap between those two layers, roughly seven times, is almost entirely the depreciation of operator-supplied silicon.
The second thing is that the price moved in 2026, and it moved a lot.
Nebius disclosed the clearest ladder anyone has published. Its baseline entering 2026 was about $12mm per MW year. Long term contracts signed in the second quarter were struck at $20-25mm. Short-term capacity in the third quarter went at $40-50mm per MW year, and sometimes above. That is $40-50BN per GW year for capacity of six months or less. Its maiden capacity auction cleared 15% above any price it had previously achieved on Blackwell, and payback on new capacity compressed from two to three years down to one year and ten months.
CoreWeave put through a roughly 25% price increase across every SKU in July and told investors near-term capacity is effectively sold out, with contribution margins on new contracts running 5-10pts above those signed in prior quarters. SemiAnalysis’s one year H100 contract index rose about 40% between October 2025 and March 2026, on a chip two generations old. Nvidia’s chief financial officer said H100 rentals were up about 20% year to date. Bernstein put IREN’s newest contracts 20-25%above its earlier ones.
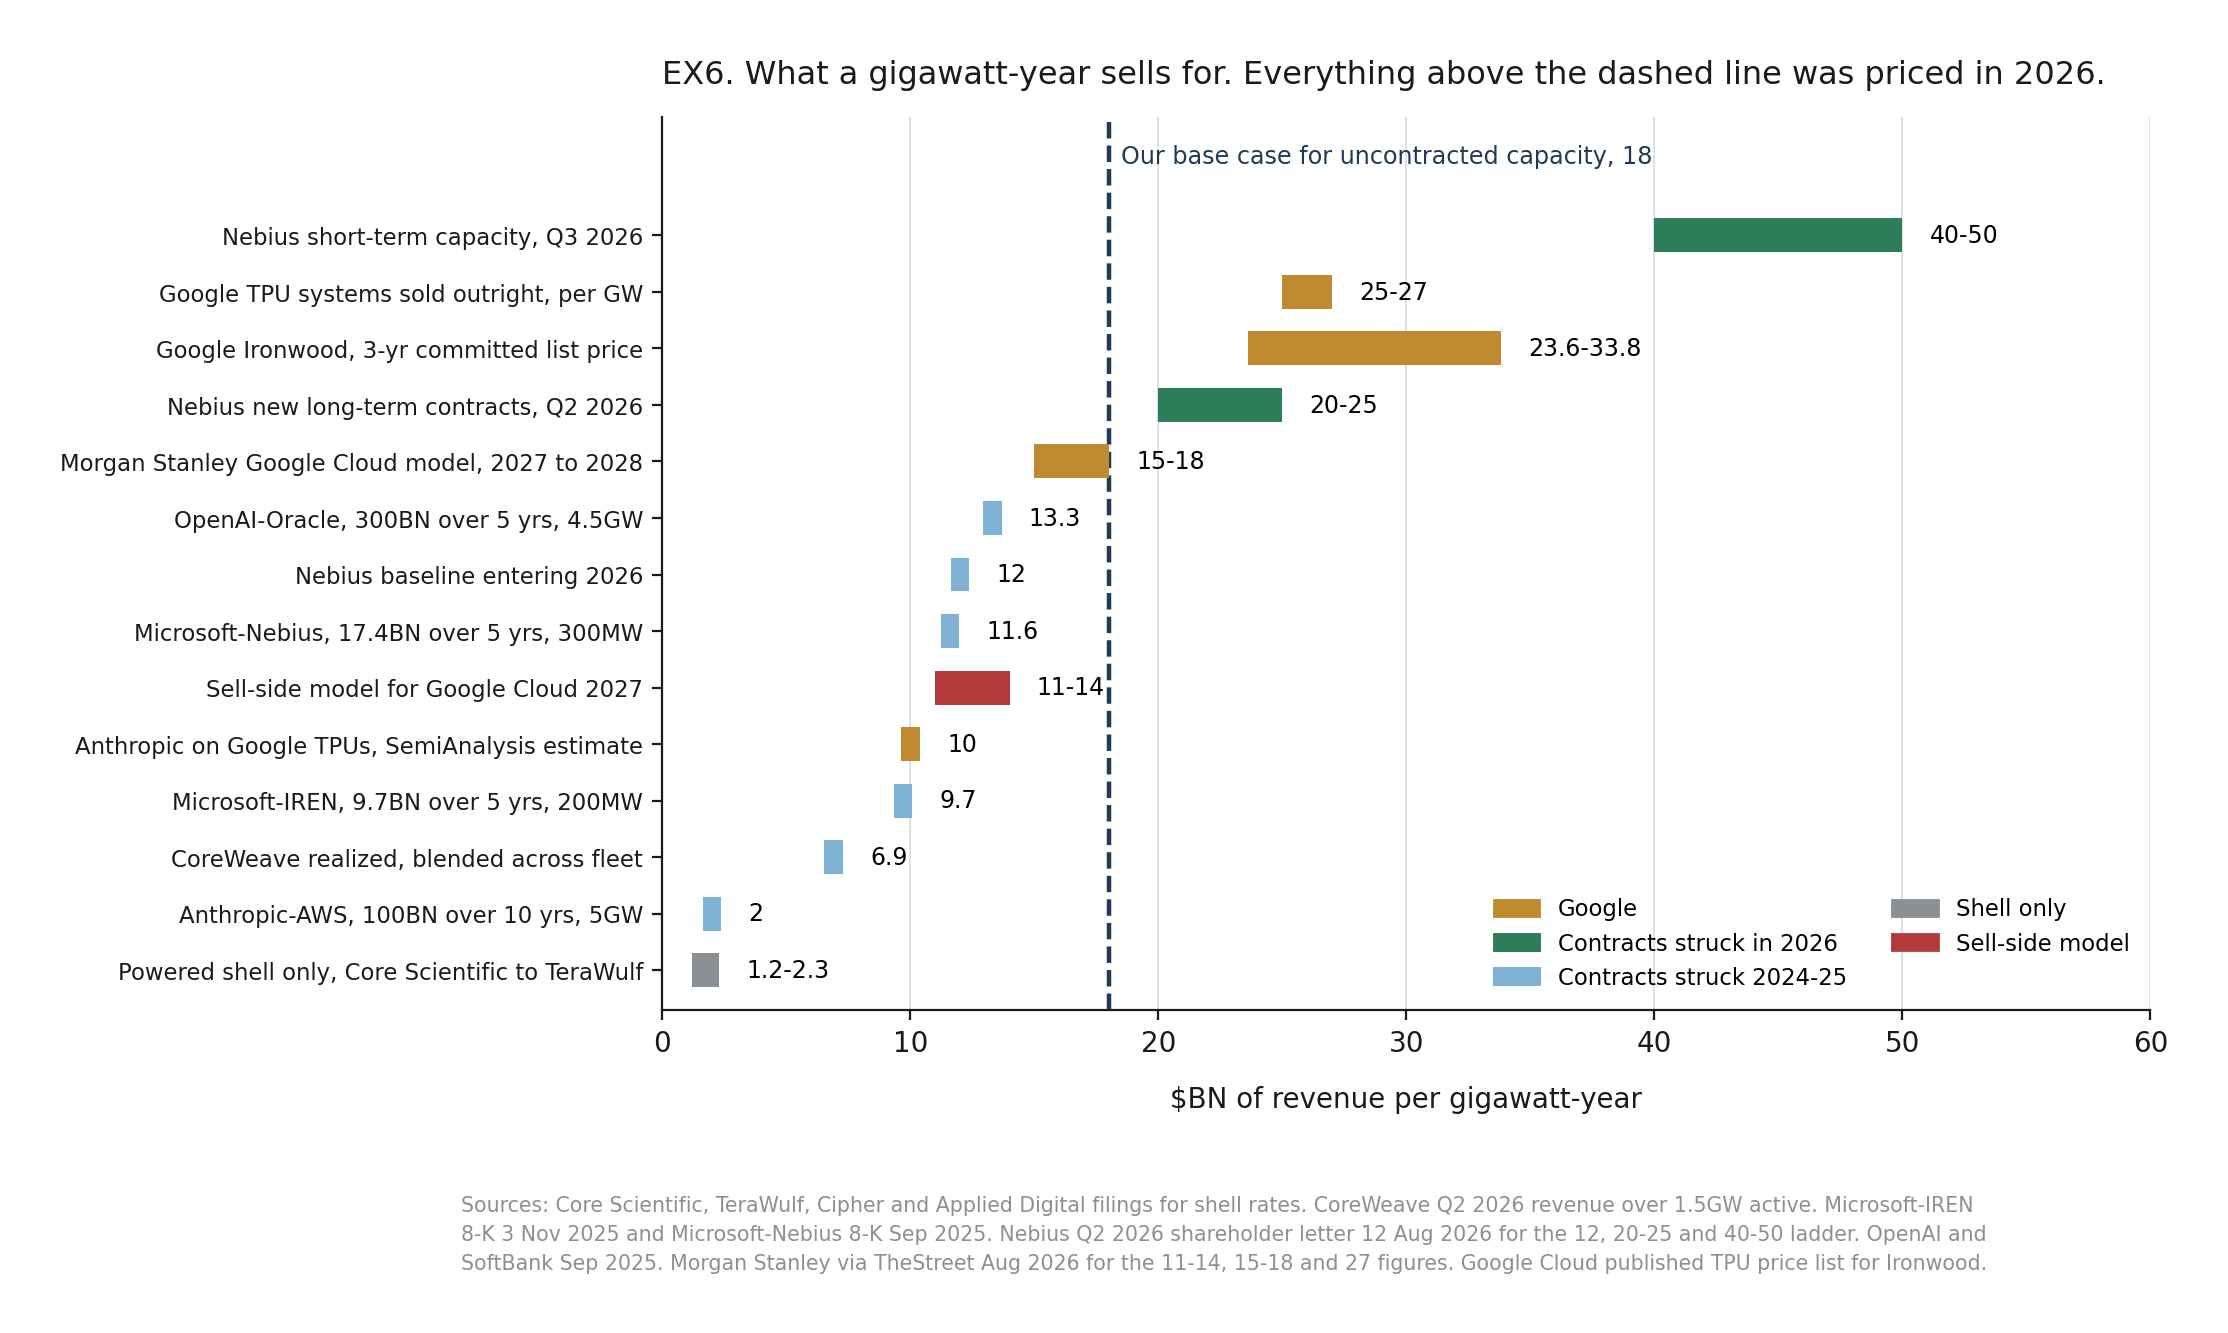
The third thing is where Google sits on that chart, and it is not where you would expect.
The reported Anthropic arrangement, $200bn over five years across roughly five gigawatts, works out to about $8-9bn per GW year at full ramp. That is the largest private compute contract ever signed and it is priced near the bottom of the observable range, because it was negotiated in 2025 at 2025 rates by the largest single buyer in the market.
Published sellside models for Google Cloud imply $11-14BN of incremental revenue per GW in 2027. Morgan Stanley’s own framework models Google at $15 per watt in 2027 rising to $18 in 2028, and notes explicitly that this is below what it calls an industry negotiation level above $20bn per Gw.
So consensus is modelling Google’s compute at roughly half of what the merchant market is currently charging.
And then there is Google’s own price list, which nobody seems to be reading.
Google publishes TPU pricing. Ironwood, the current generation, lists at $12.00 per chip-hour on demand, $8.40 on a one-year commitment and $5.40 on three years. Convert that at roughly 714,000 accelerators per gigawatt, which assumes 1.4 kilowatts all-in per accelerator including networking and cooling overhead.
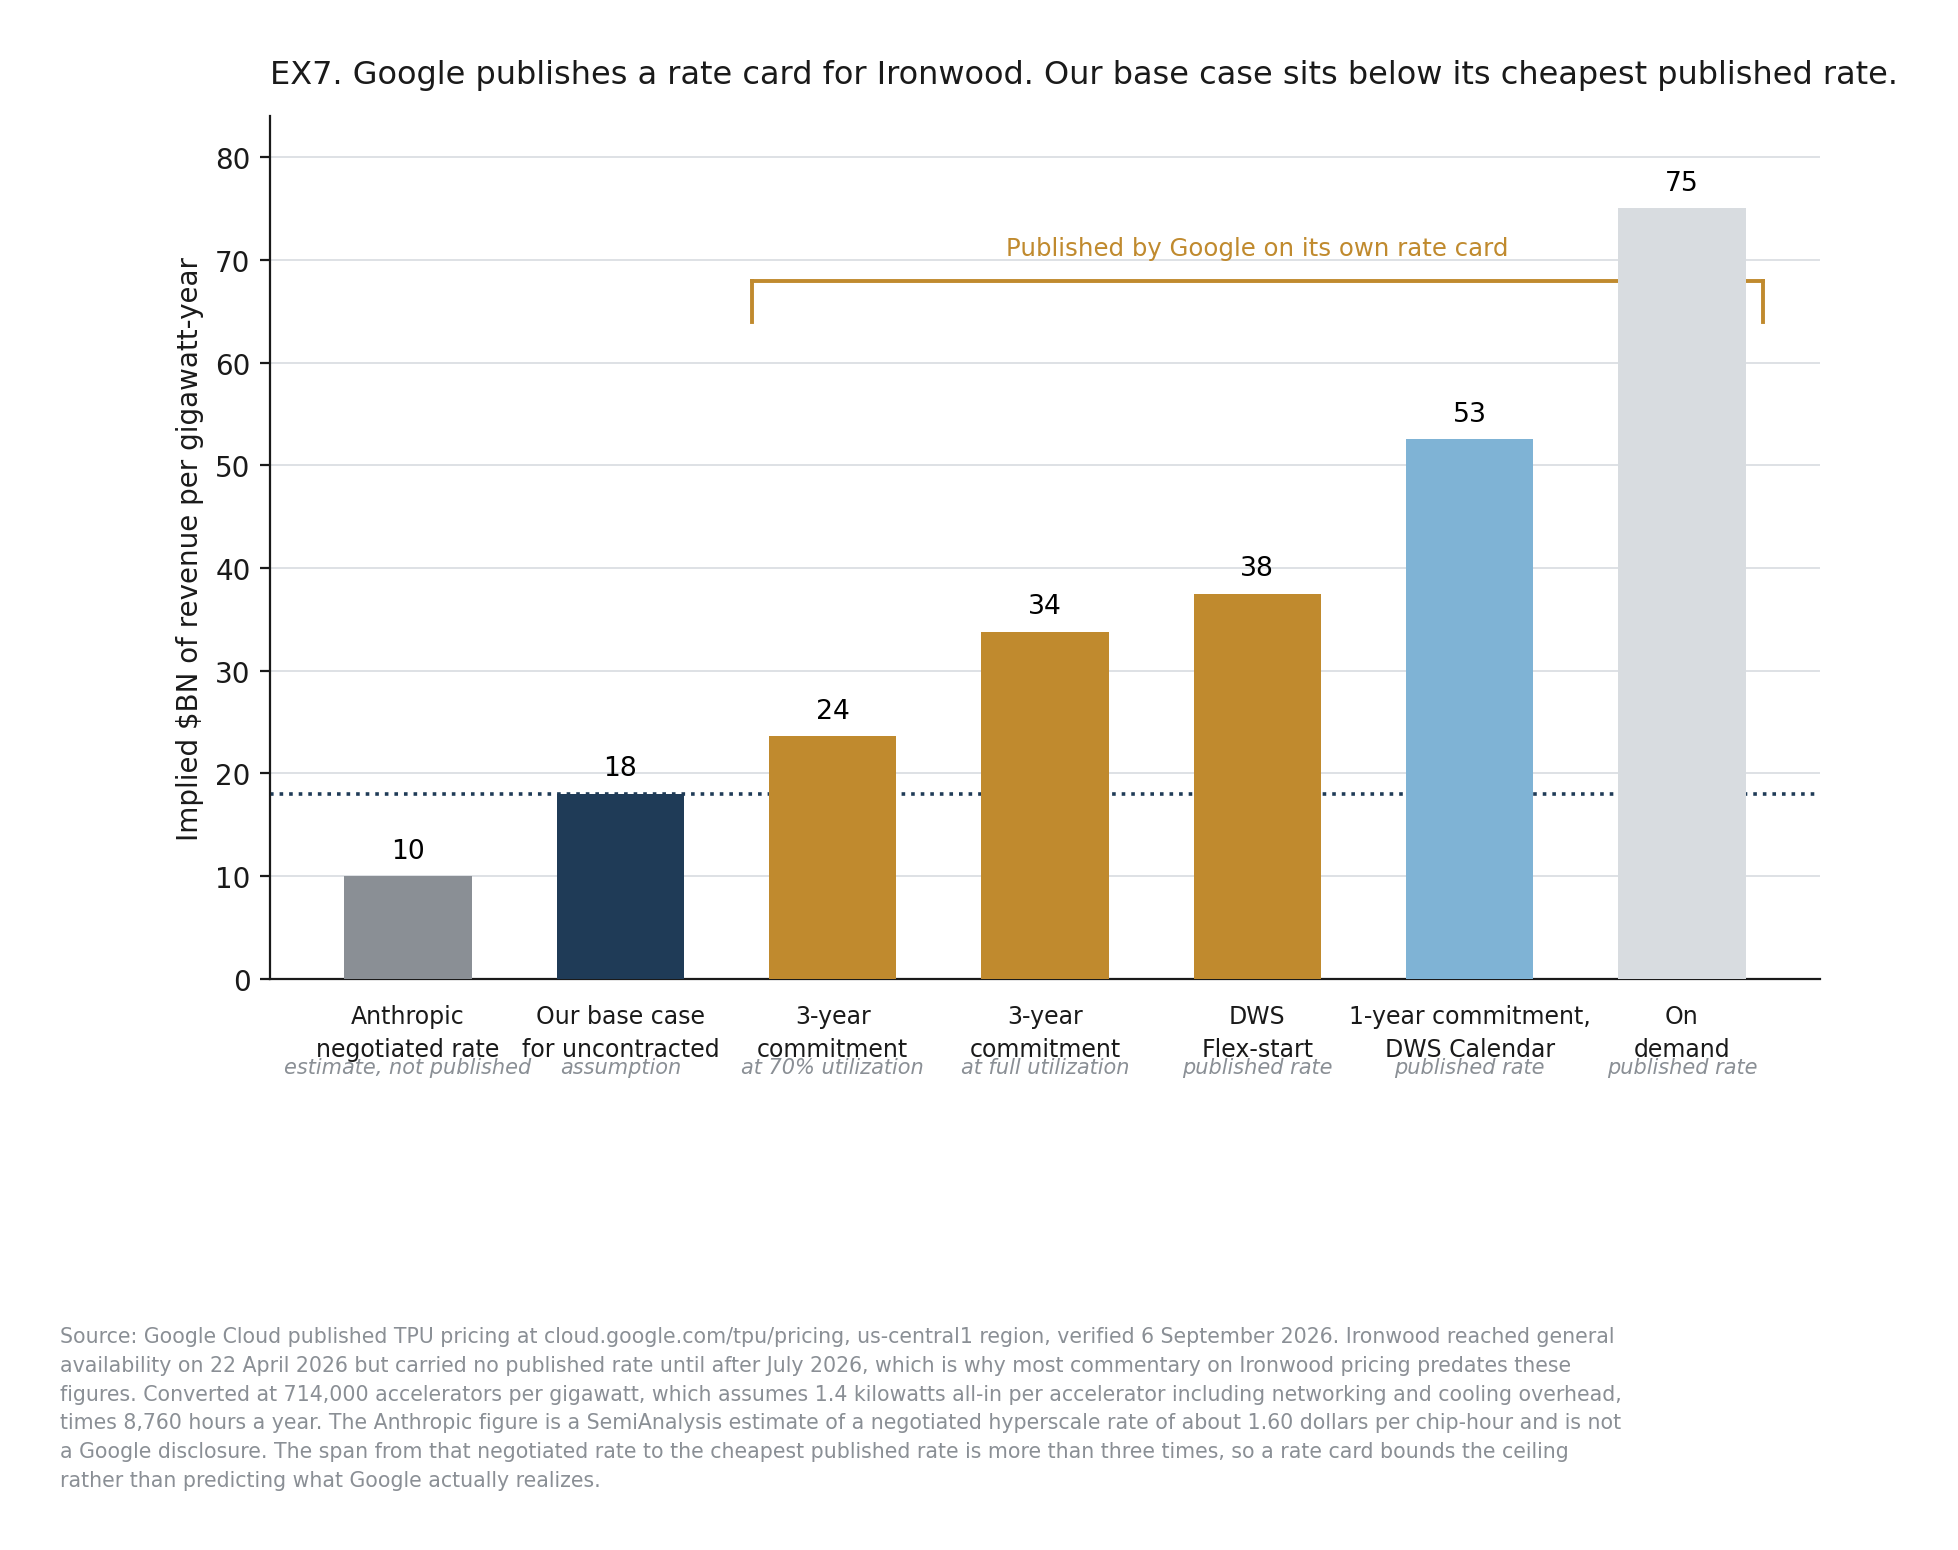
Google’s own three-year committed list price implies $34bn per GW at full utilization, or $24bn at 70%. Our base case assumption of $18bn sits below every rate Google publishes, including the cheapest one after a 30 percent utilization haircut. SemiAnalysis’s estimate of what Anthropic actually pays, about $1.60 per chip-hour, implies $10bn, which tells you how large the discount is to the single largest customer.
We are not claiming Google will realize list price, nobody realizes list price. We are pointing out that the model assumes Google captures roughly half of its own published three year committed rate on capacity it has not sold yet, and that this is a conservative assumption rather than an aggressive one.
5. The window
Put the two halves together and the setup becomes clearer than either half alone.
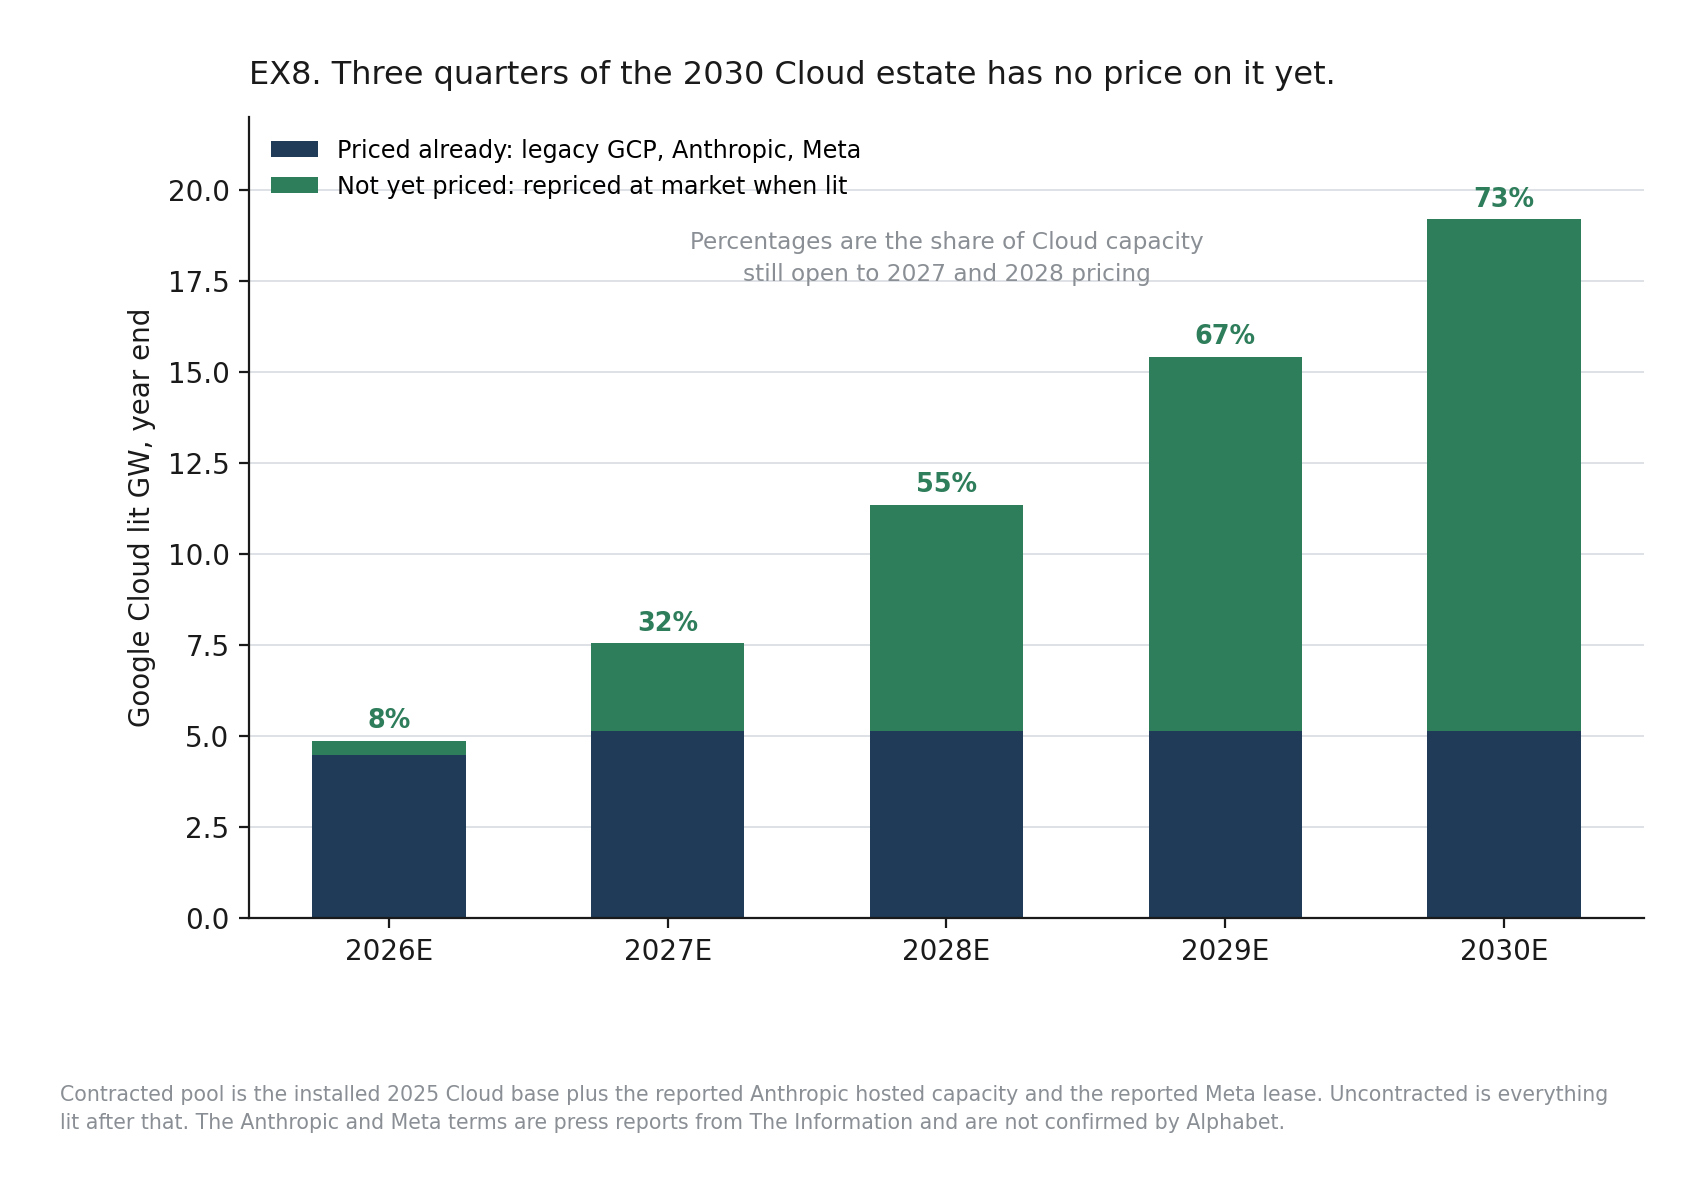
8% of Google Cloud’s capacity is unpriced this year. By 2028 it is as much as 55% and by 2030 it is 73%. The legacy book and the Anthropic and Meta contracts are locked at rates struck in 2025 and earlier. Everything lit after, we believe gets priced at whatever the market clears at on the day it is energized. And it is being energized into the tightest compute market anyone has seen. SemiAnalysis counts roughly 20 GW energized industry-wide in 2026 and expects about 30 in 2027, against demand that Morgan Stanley models as a 38 to 49 GW shortfall through 2028. Texas has paused its interconnection queue pending an audit. Half a dozen counties have moratoria.
Every one of those constraints is a reason our delivery timing might be too optimistic. Every one of them is also a reason the price on delivered capacity goes up. If power scarcity delays Alphabet’s buildout, the same scarcity raises the rate it can charge on whatever it does deliver. The two things that make us wrong on timing make us conservative on price. They do not compound in the same direction.
One thing does compound, and it is the actual risk. If demand cracks, then delivery is easy, pricing collapses and utilization falls, all at once. That is the scenario where this does not work, and no amount of construction mapping would have told you about it.
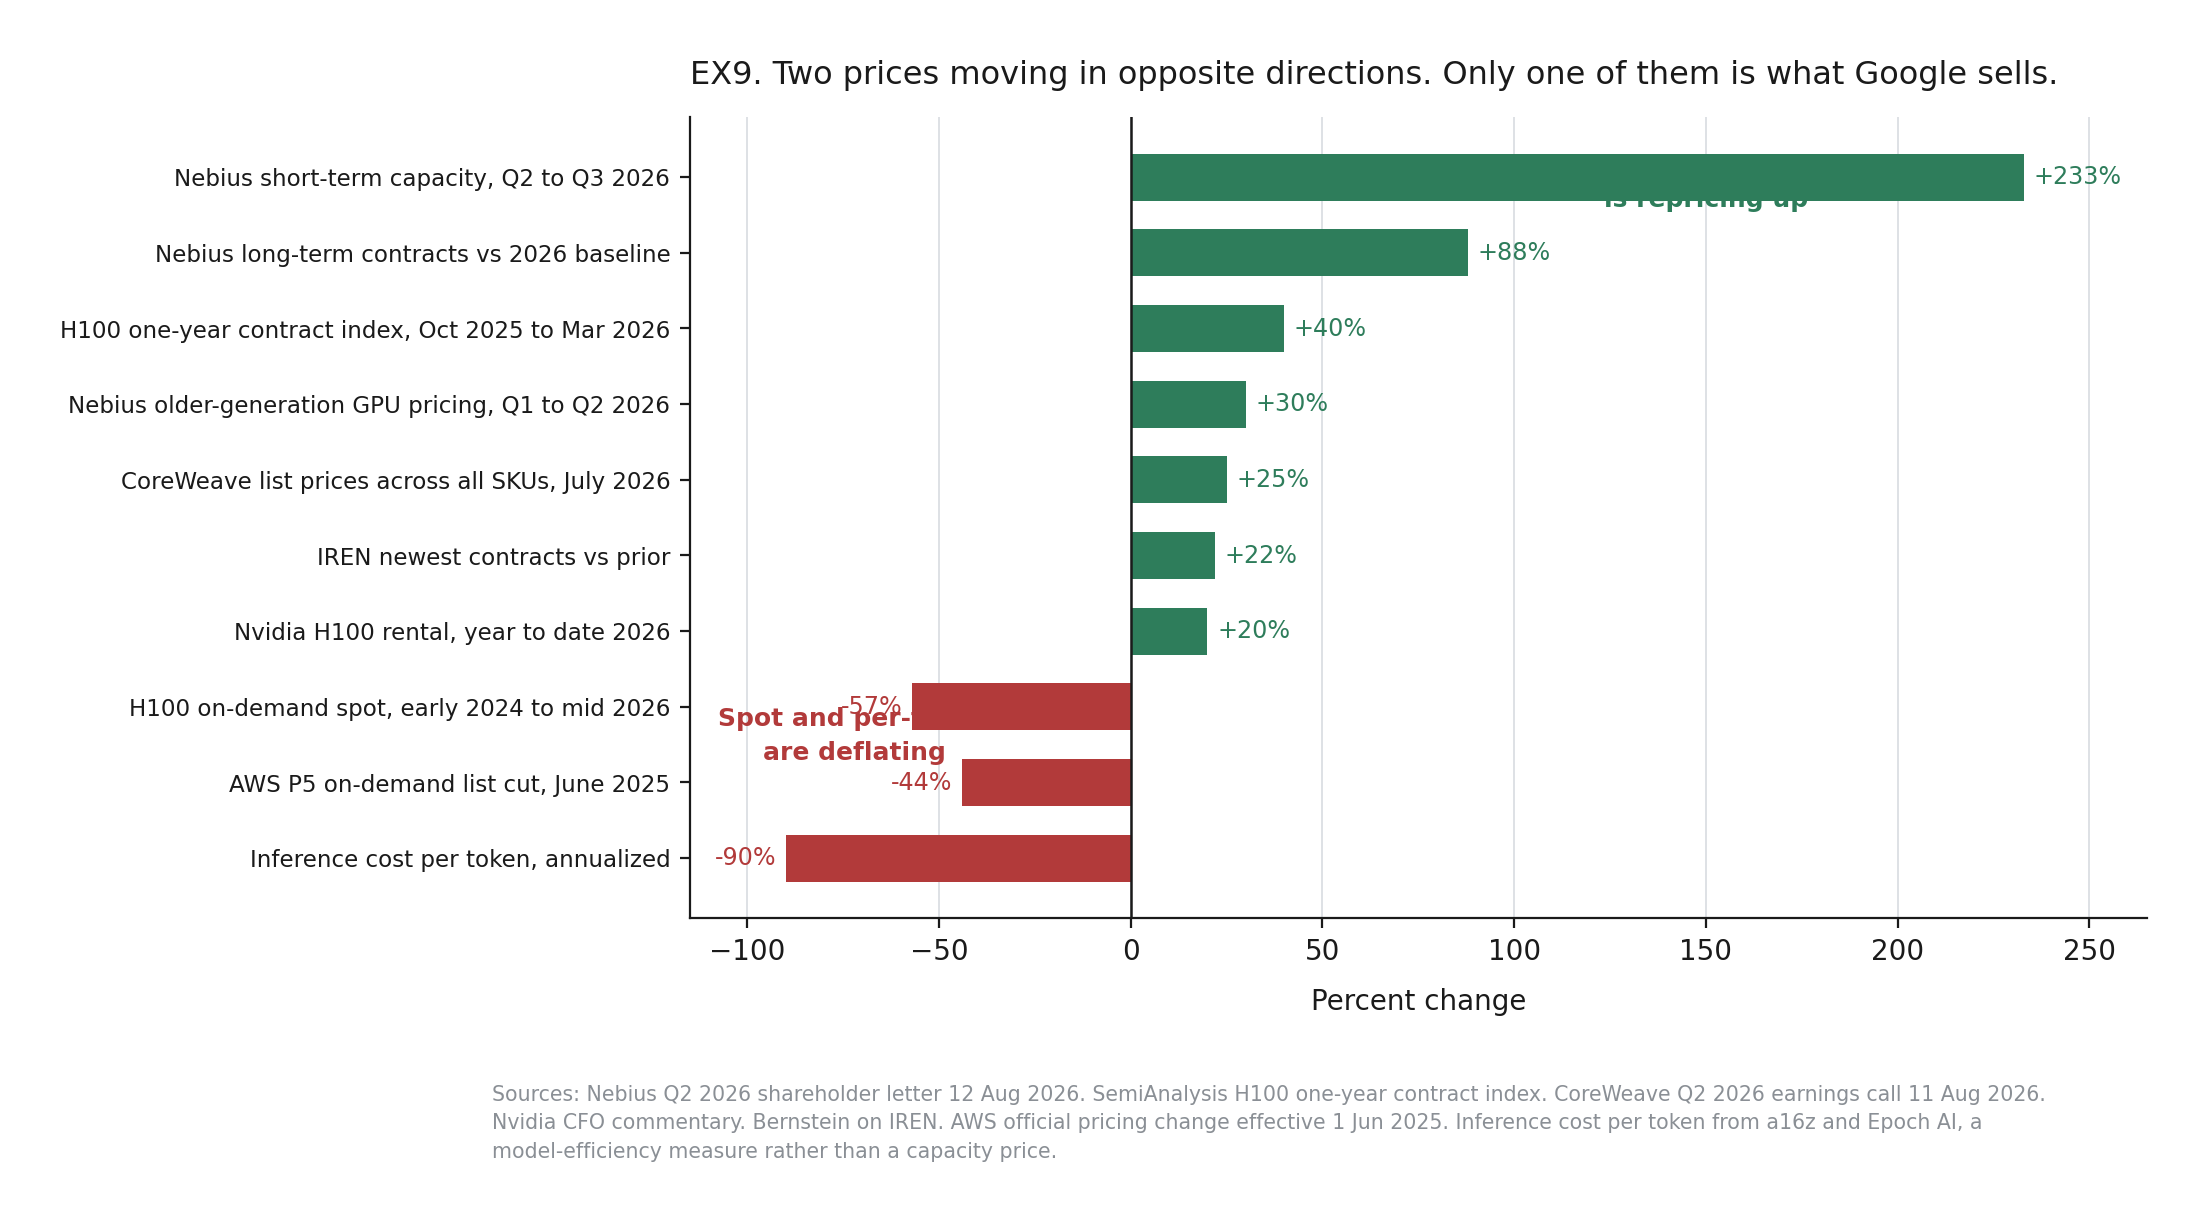
The bear case on pricing deserves a fair hearing because it is real and it is loud. Spot rental rates for H100s have fallen roughly 57% from their early-2024 peak. AWS cut its P5 on-demand list price 44% in June 2025. Inference cost per token is collapsing at something like an order of magnitude a year. TD Cowen’s channel checks found Microsoft cancelling or deferring data center leases, which the firm reads as a potential oversupply signal.
Every one of those is about a different thing than what Google sells on a multi-year contract. Falling spot prices in 2026 coincided with contract prices rising 40% because serious buyers migrated out of spot and into committed capacity as on-demand sold out. Per-token deflation is a model efficiency gain, and Google itself has disclosed cutting Gemini serving costs 78% in a single year, which raises the output a GW can produce rather than lowering what the gigawatt rents for.
6. Why pay Google more
There is a piece of this that does not show up in any comps table.
Alphabet is a company with $155bn of cash, effectively no net debt, an Aa2 rating and a stable outlook, selling a multi-year compute contract. The merchant alternatives are, in several cases, former bitcoin miners financed through SPVs with private credit, residual value guarantees and, in a number of the largest deals, a credit backstop from Google itself. Alphabet discloses $43.8bn of maximum potential payments under credit derivatives backstopping data center payment obligations, plus $7.6bn of guarantees for suppliers buying long-lead power equipment and $24.1bn more agreed but not finalized.
If you are a chief information officer signing a five year commitment for capacity your business now depends on, the identity of the counterparty is part of what you are buying. So is the security posture, where Alphabet has bought Wiz and Mandiant and folded them into the stack. So is distribution, where Google reaches both the consumer surface and the enterprise, and where Thomas Kurian has said nine of the ten largest AI labs are already customers, that customers using AI products consume 1.5 times as many Google Cloud products as those who do not, and that customers who sign commitments routinely over-attain them.
7. The inversion
So I stopped forecasting bottoms-up and asked the only question that can be answered.
Alphabet’s market capitalization at $335 is $4.1tn. Take out $57bn of net cash, the entire securities portfolio at reported value ($101bn of SpaceX stock and $131bn of non-marketable holdings dominated by the Anthropic stake). What remains is a core business priced at $3.8tn.
At 25x 2030 FCF (roughly the 10 year average), you need visibility to ~$150bn of FCF.
Now run the model at every price point in the observable range, changing nothing else.
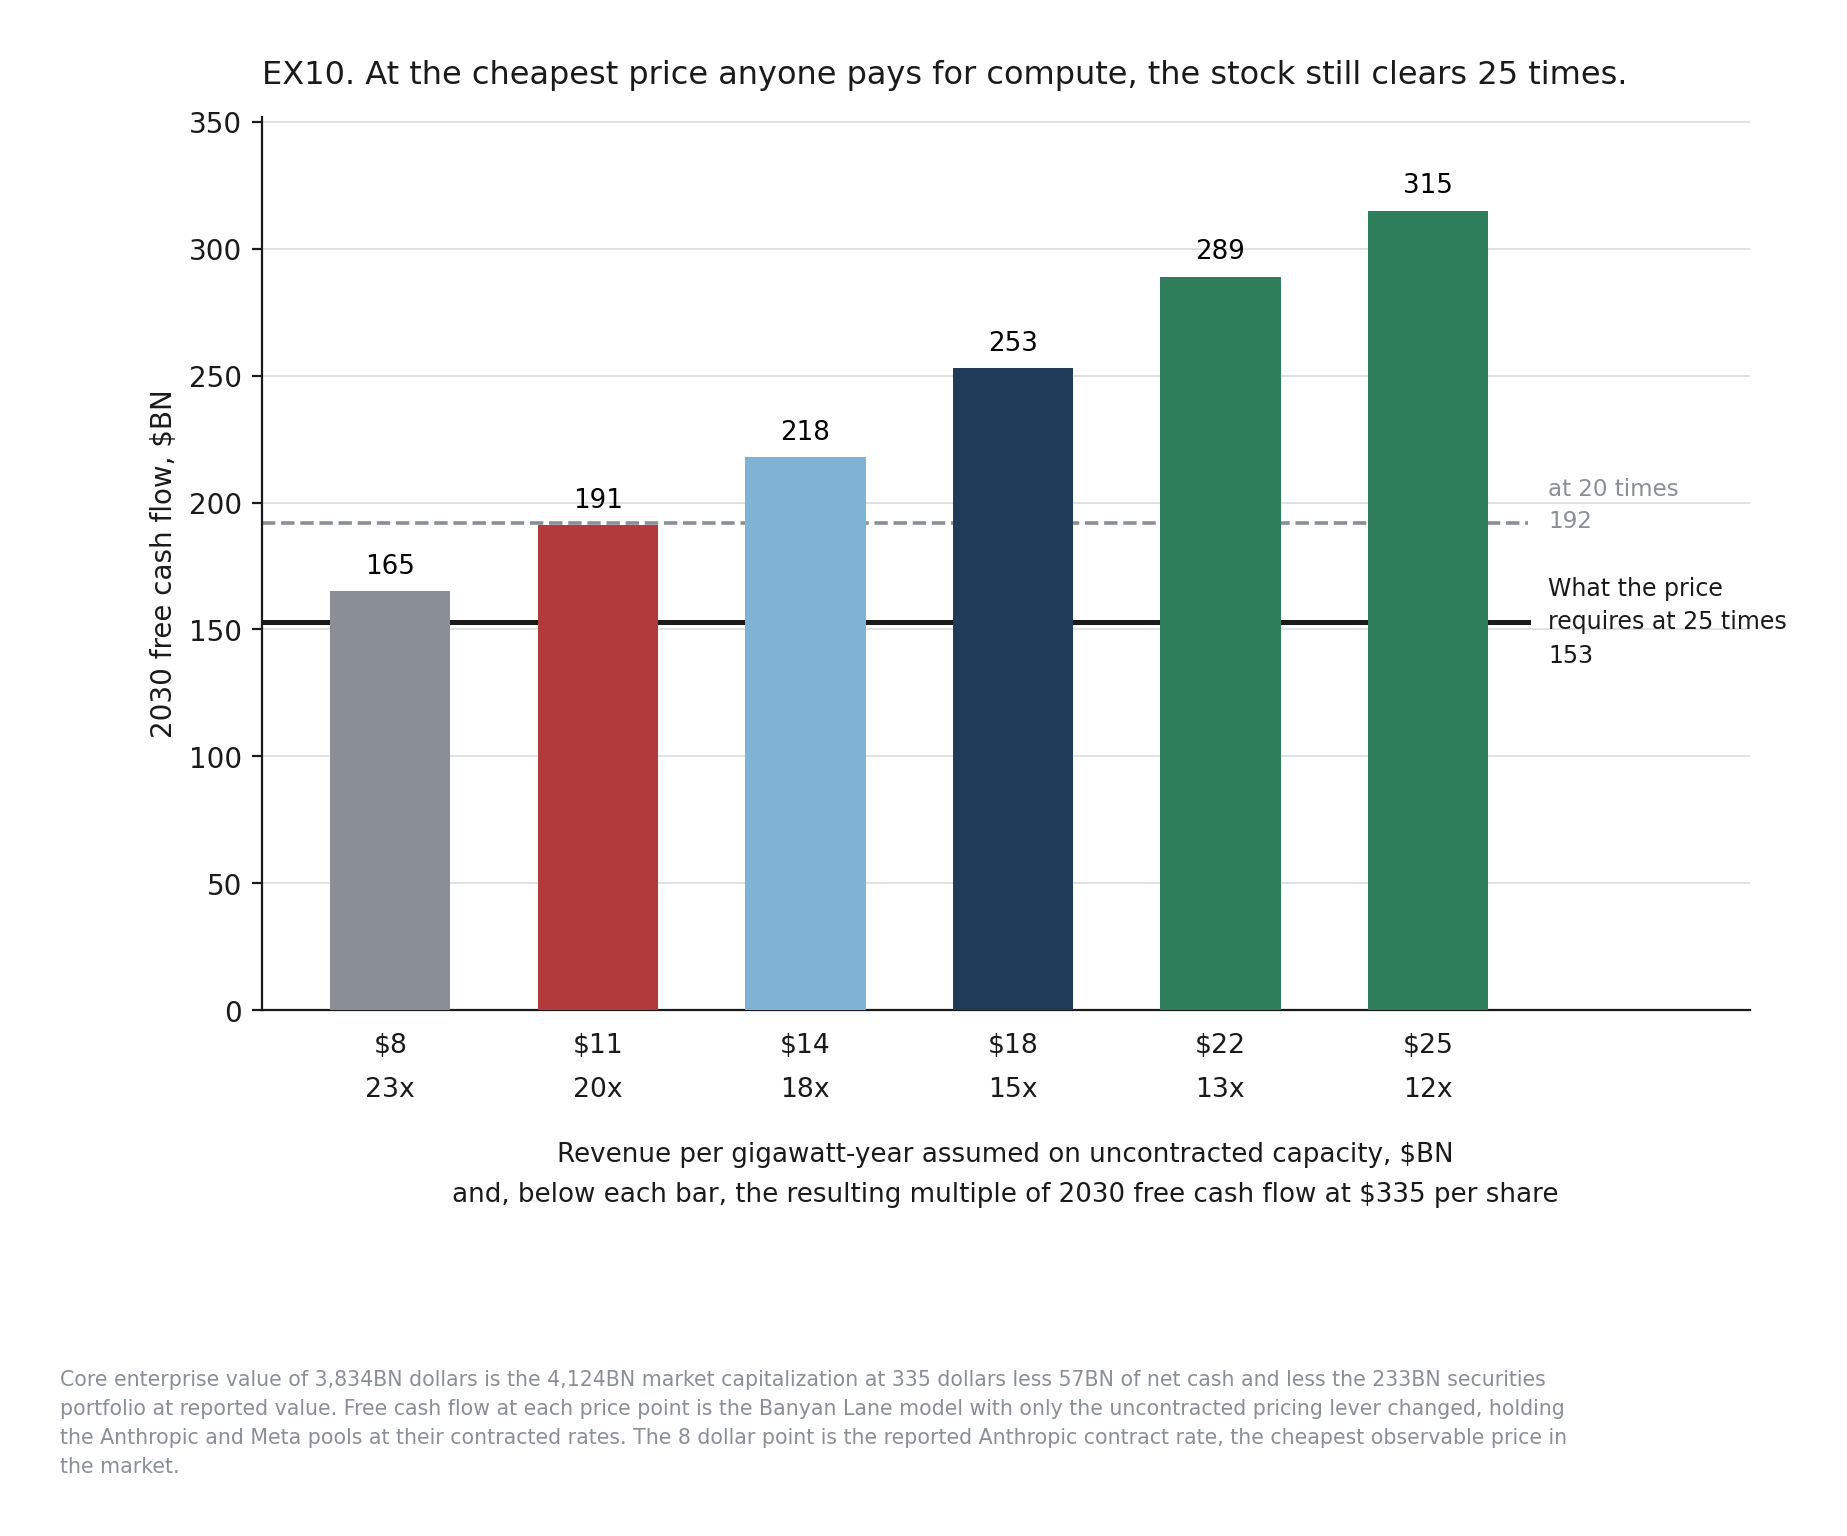
At $8bn per GW year, which is the reported Anthropic rate and the cheapest price anyone has paid for compute at scale anywhere, Alphabet produces $165bn of FCF in 2030 and the stock trades at 23x.
At consensus pricing of $11bn, it is $191bn and 20 times. At our base case of $18bn, half of Google’s own three year committed list rate, it is $253bn and 15x. At the rate Nebius is signing long-term contracts today, it is $315bn and 12x.
The bear case…. where pricing is low and costs are high and delivery slips and chip life proves to be five years and the installed base was smaller than we thought, produces $50bn of FCF in 2030. That is 77x and it does not clear anything. The bull case produces $612bn, which is 6x.
So the width of the distribution on a five-year view of a company spending $1.56tn is enormous, and anyone quoting a point estimate on this is not being straight with you. What the inversion tells you is narrower and more useful. No single variable breaks this. The variables have to fail together. And the two most likely failure modes, power scarcity and slow permitting, push price up while they push volume down, which is a partial hedge rather than a compounding loss.
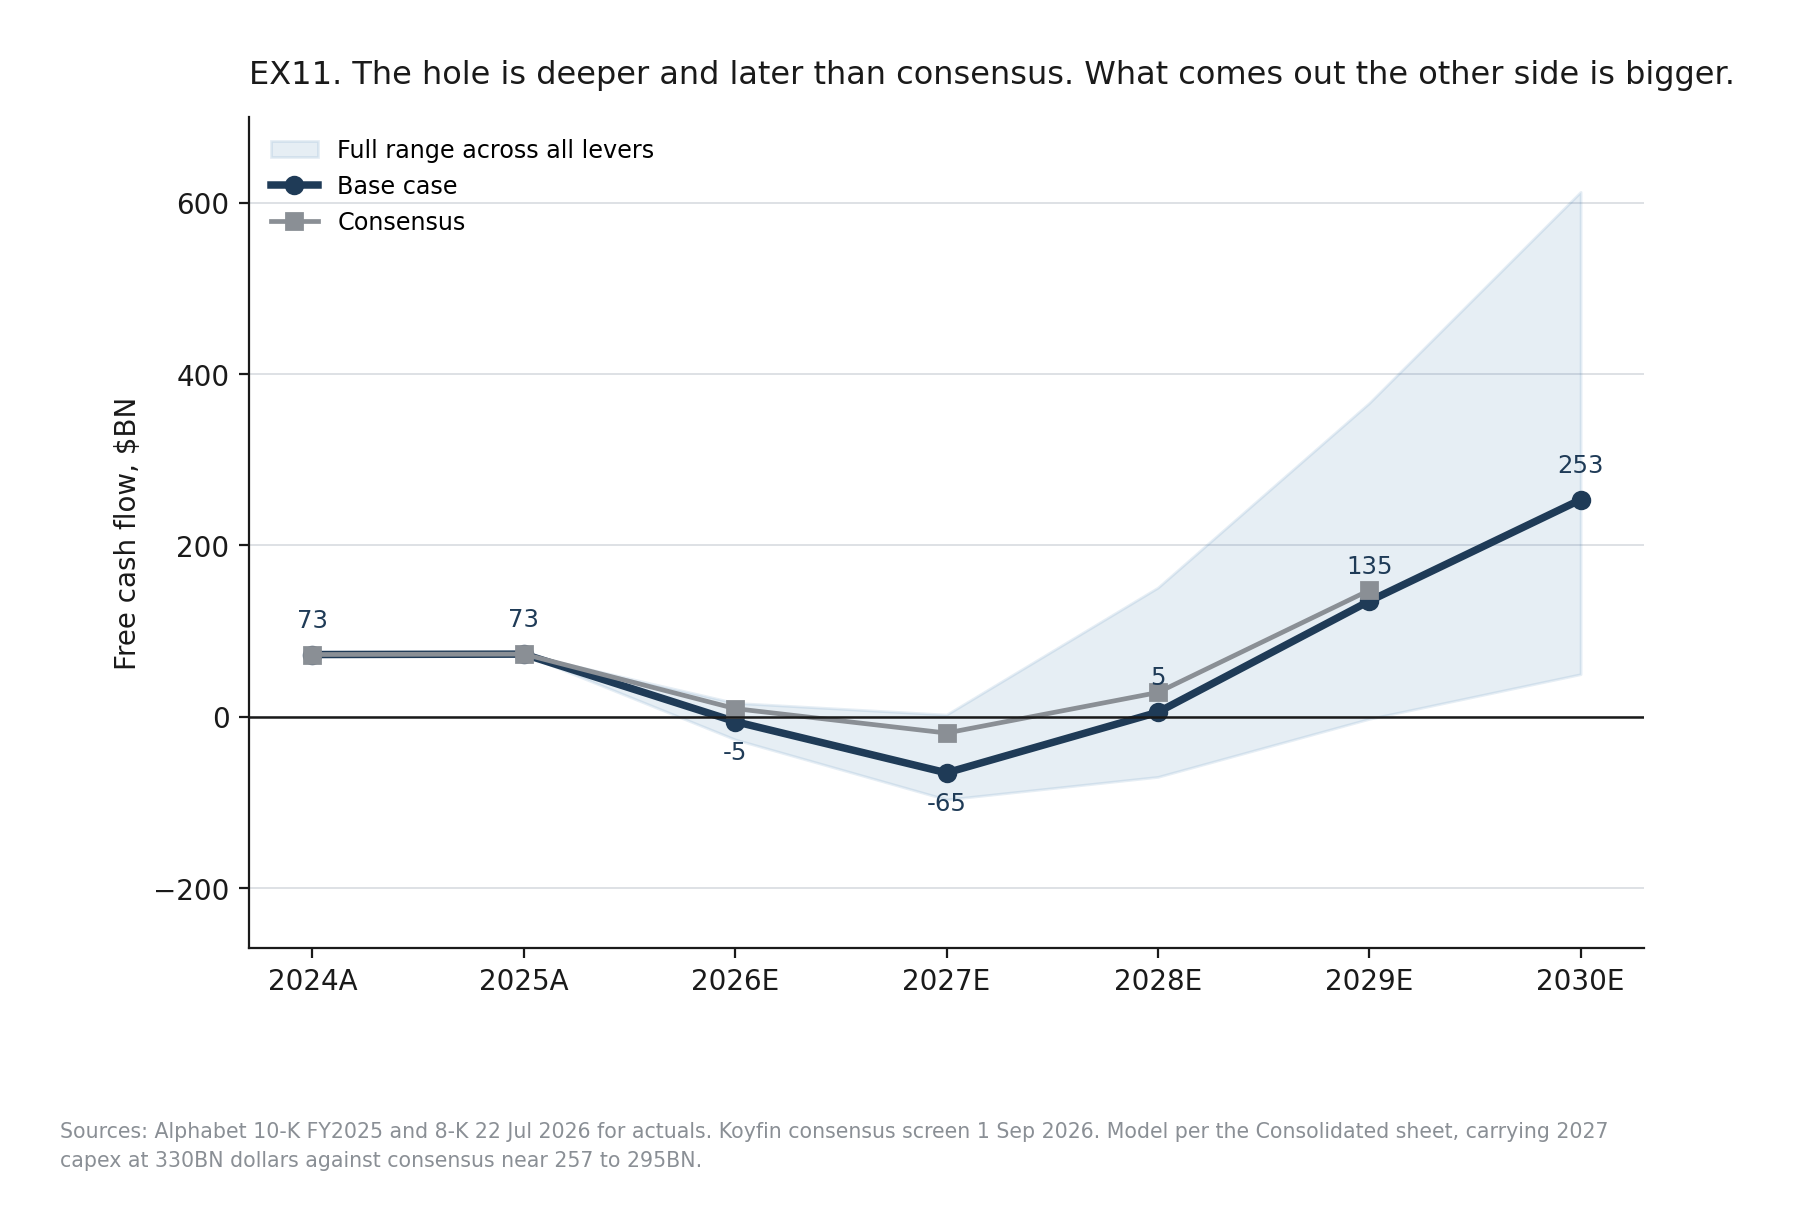
For what it is worth, our base case has the hole deeper and a year later than consensus. Minus $65bn in 2027 against consensus at minus $19bn, almost entirely because we carry 2027 capex at $330bn, or as much as 10% above consensus. Run the operating model on consensus and the 2027 gap narrows to about $11bn.
8. Funding
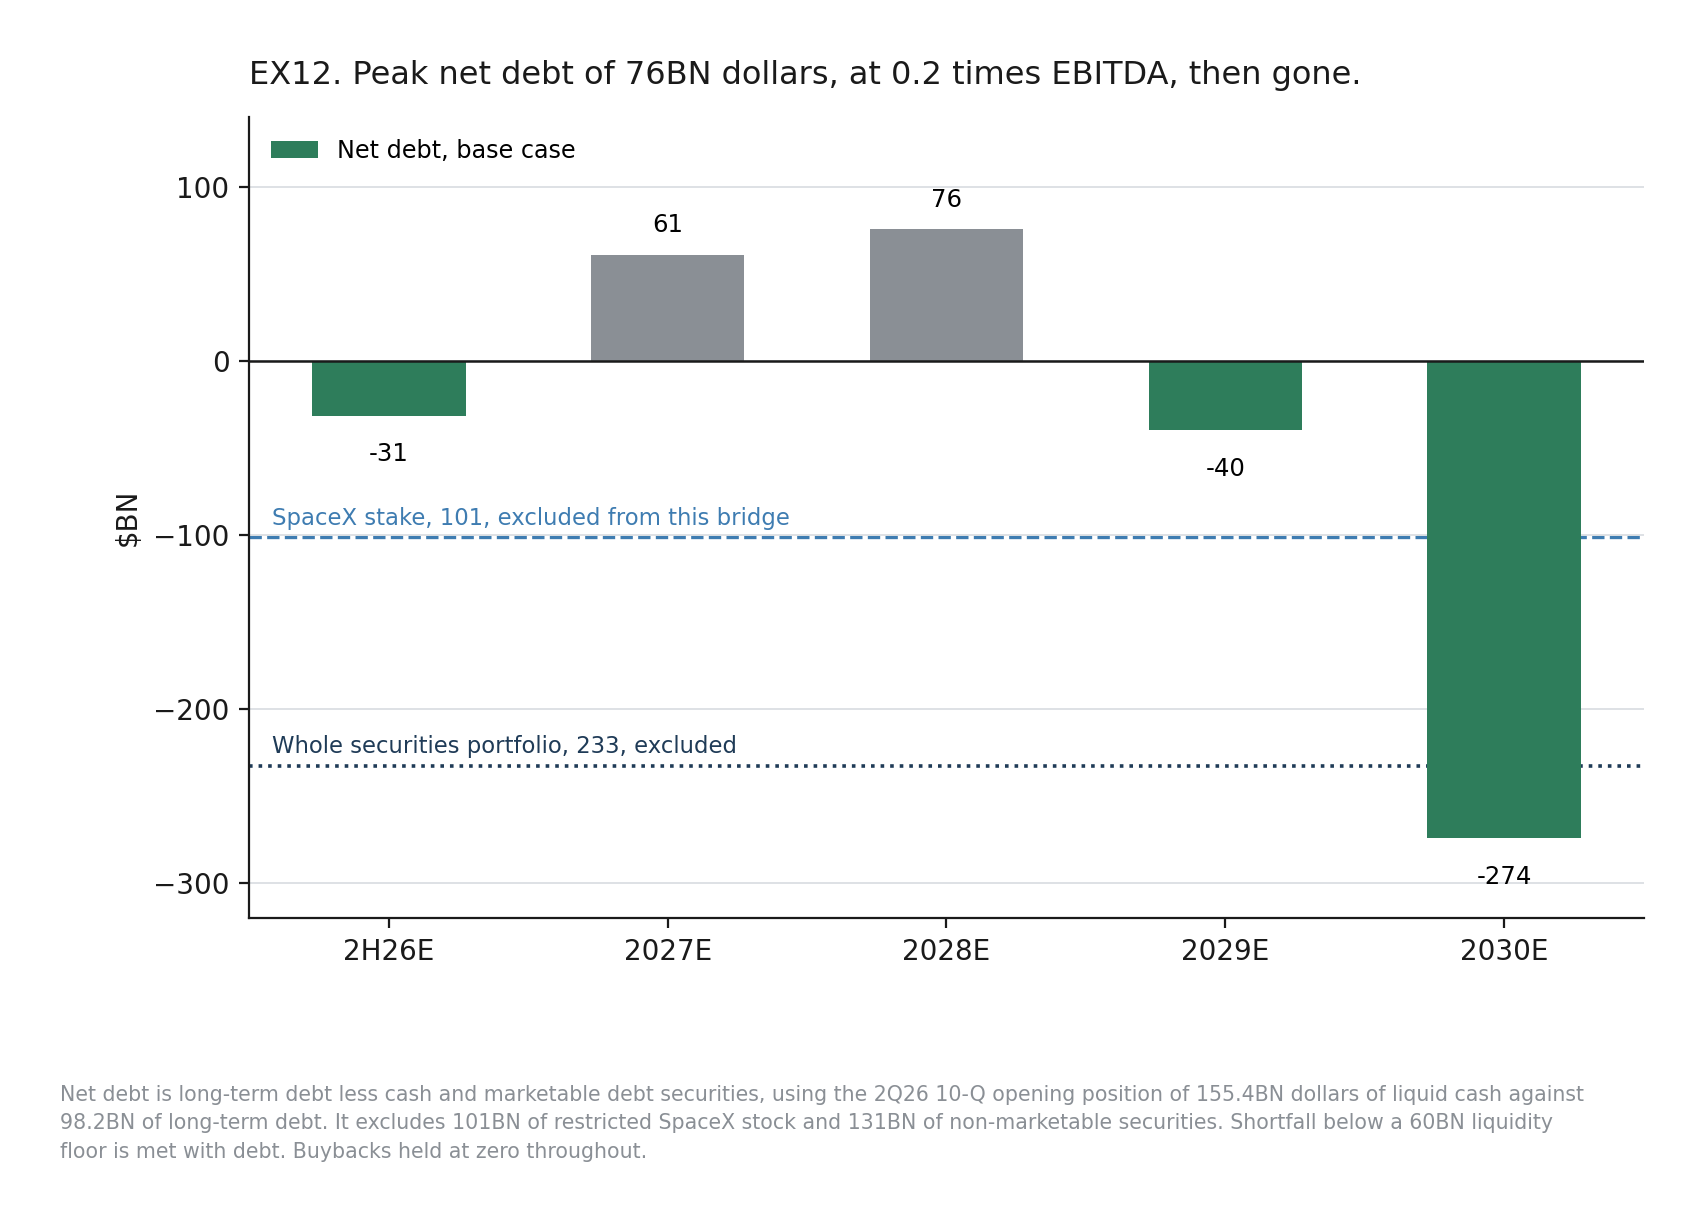
Net debt peaks at $76bn at the end of 2028, which is 0.2x EBITDA, and is gone during 2029. Peak incremental borrowing across the whole program is $37.5bn. Moody’s affirmed Aa2 stable in May and S&P AA+ stable, with S&P forecasting adjusted debt to EBITDA of 0.2-0.3x.
That bridge excludes $101bn of SpaceX stock and $131bn of other securities. Include the SpaceX position at reported value and Alphabet never crosses into net debt at all. The 551 million SpaceX shares carried at $94bn cost roughly $900mm in 2015.
The funding question here is genuinely uninteresting. The $40bn at-the-market program authorized in June is unused. The preferred converts to equity in May 2029. Alphabet could fund the entire remaining burn by selling a third of a position it did not know it needed.
9. What to watch
The value of the site-by-site work is not that it produced a number. It is that it produced a list of things that resolve on dates, which converts an unmodelable company into a monitorable one. Here is a long list of items to watch into Q3 earnings and beyond.
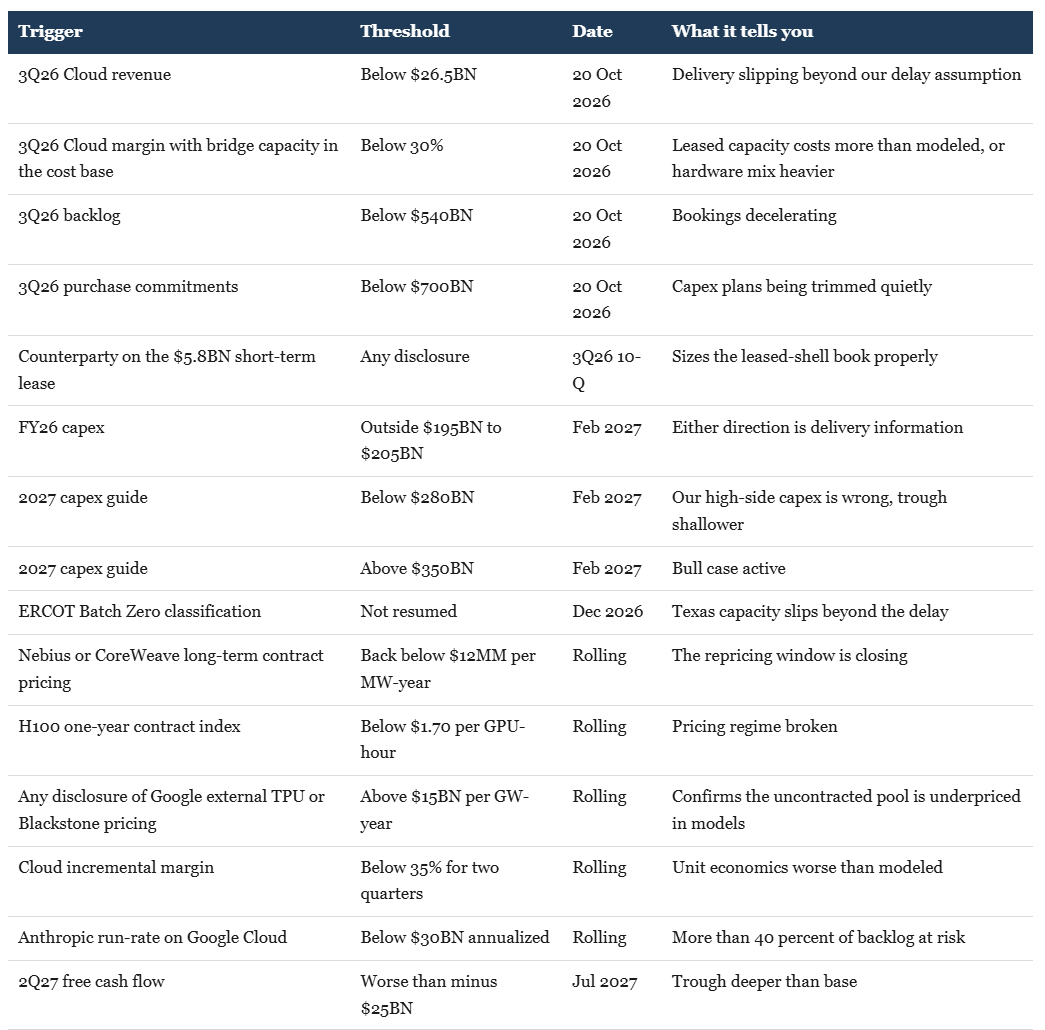
The three that matter most are the 2027 capex guide in February, because it settles whether the spending path is real, any disclosure of external TPU pricing, because it settles the repricing question, and the direction of merchant contract rates, because that is the highest-frequency read on whether the window is open or closing.
10. Conclusion
It is unlikely that anyone outside of perhaps SemiAnalysis can model this business with any precision. And even then, there are human factors that are unquantifiable here. However, it is indisputable that Google Cloud is becoming the majority of Alphabet’s earnings power on a timeline that is short, and the market has not had to price that because it is happening underneath the worst-looking cash flow profile in the company’s history.
The capacity being built is landing in the tightest compute market on record, and roughly three quarters of it has no price on it yet. Contracts struck in 2026 may clear at as high as 2-4x the rate embedded in published models, and Google’s own three year committed list price implies double what the models use. Every observable failure mode on the physical build makes the pricing better.
Furthermore, the full deltas diagram below shows the sensitivity in the model to all of the variables, from bear case to bull case. The market should be more worried about advertising risk downside, however that downside reflects a dramatically different macro environment to be fair.
Alphabet is one of a very small number of counterparties that can credibly sign a 10 year compute commitment, and across a large share of the merchant market it is already the credit standing behind somebody else’s lease.
And when you invert the question rather than forecasting it, the price at $335 requires roughly $153bn of FCF in 2030 against a model that produces $165BN at the cheapest price anyone has ever paid for compute and $253bn at half of Google’s own list rate.
While we should all monitor the construction schedule, we really care most about the moment the market decides the cash flows are coming, because that is when a business growing operating income at this rate, with half of it not yet priced, stops being valued on the burn and starts being valued on the ramp in FCF possible beyond.
Appendix
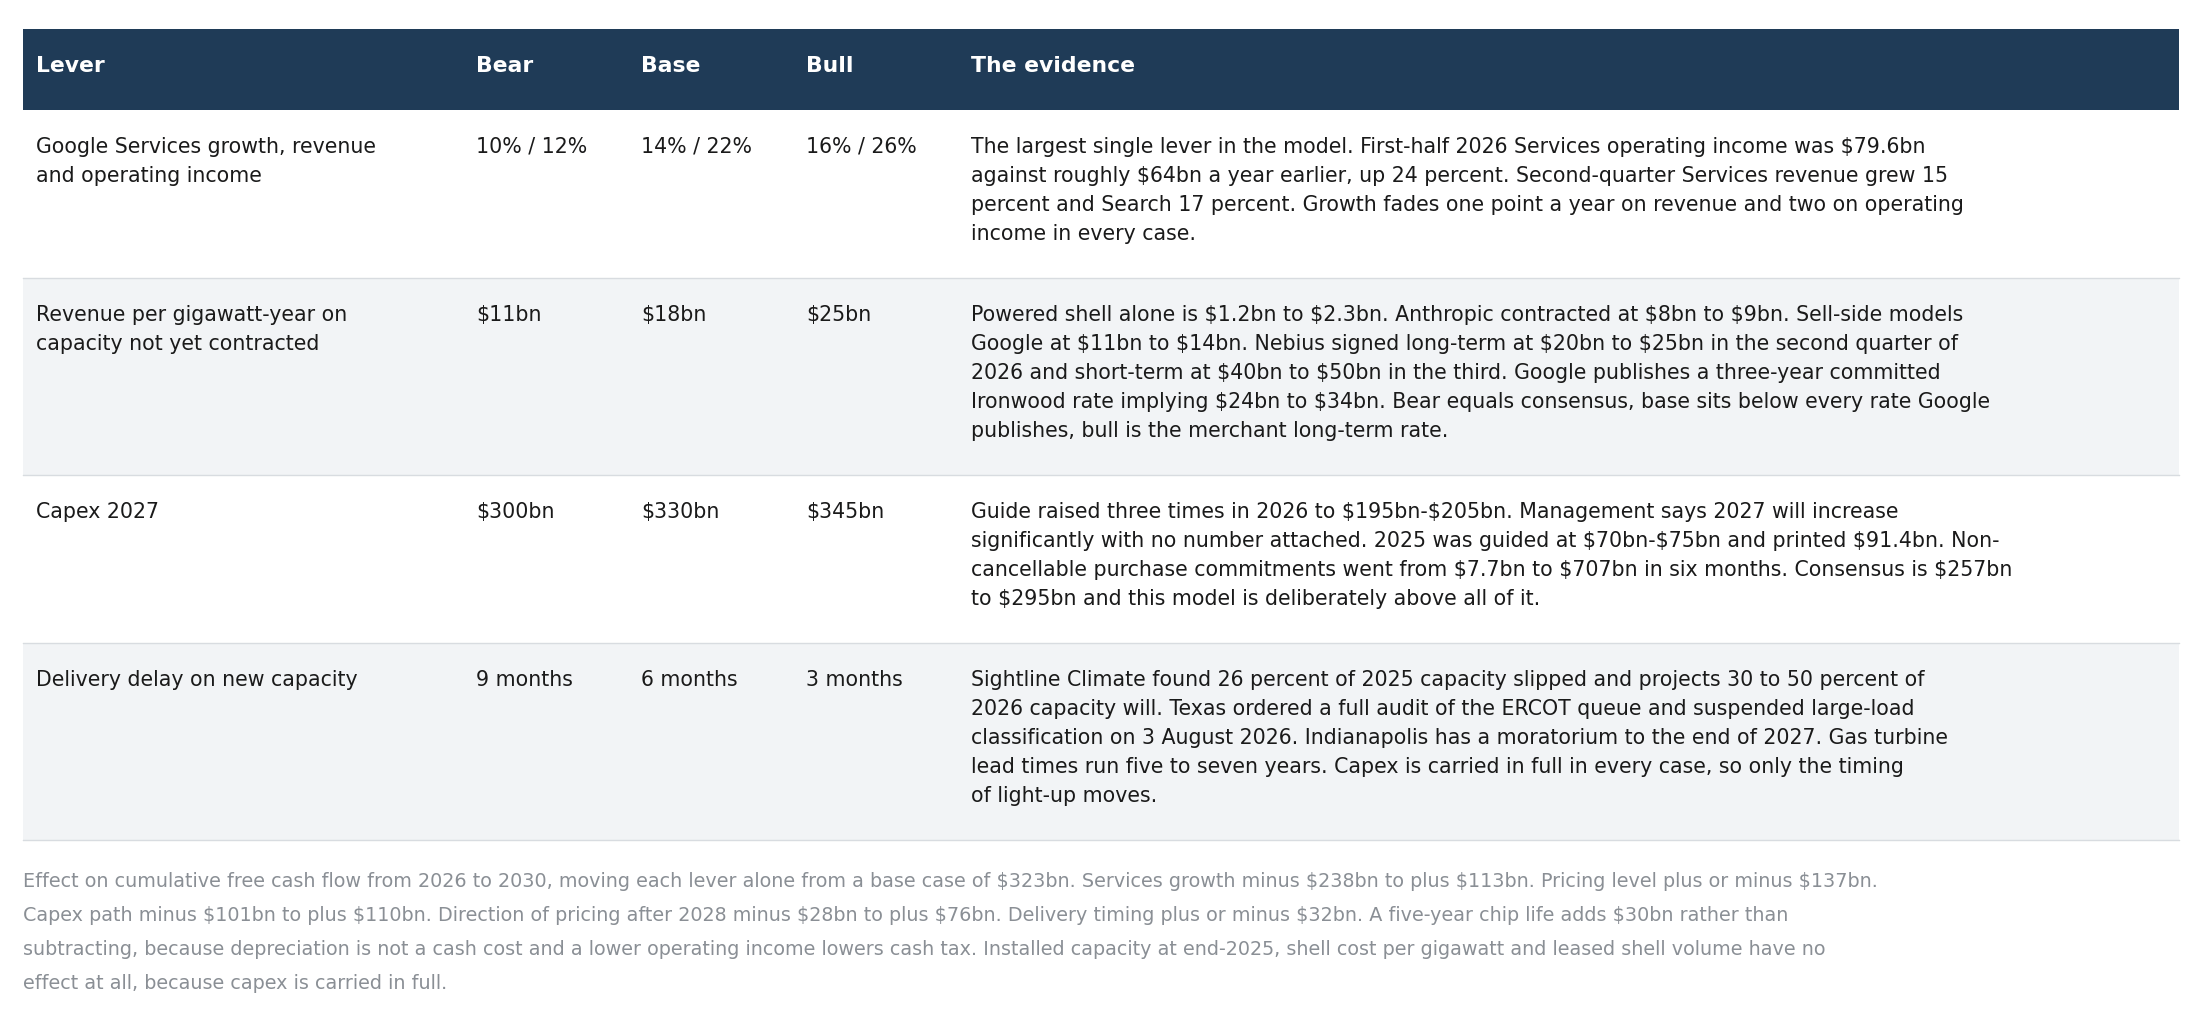
Four assumptions that matter
Everything in this note reduces to four levers. The rest is noise at five years' distance. Each is shown with the observable evidence rather than a point estimate, so a reader can substitute their own.
Named capacity register
Thirty-three projects. Structure A is an owned shell with Google chips, B is a leased shell with Google chips, C is a third-party site where Google sells TPU systems rather than renting capacity. Megawatt figures for owned campuses are estimates, because Alphabet discloses none. Both tables are downloadable images.
Pricing comps
All figures are total contract value divided by term and by capacity, which is a bookings average and not a steady-state realized rate. Layer matters more than any other adjustment.
What we couldn’t resolve
The Anthropic and Meta contract terms are press reports and neither company has confirmed them. We do not know whether either carries an annual escalator, whether they are leases with a rent schedule or minimum spend commitments, or how capacity is measured for billing. We model Anthropic flat at $8.5bn per gigawatt-year and flag that the contract form itself is unknown.
The counterparty, megawatts and term of the $5.8Bbn short-term lease commencing in the third quarter of 2026 are undisclosed. We model roughly 0.3 GW of full-stack compute over twelve months.
Installed lit capacity at the end of 2025 is not disclosed anywhere. Our 8.5 GW starting point is triangulated from cumulative capex.
Segment capex and segment depreciation are not disclosed and are allocated by lit-gigawatt share. This is the largest single judgment in the model.
The $707bn purchase commitment figure comes from secondary sources quoting Note 10 of the second-quarter 10-Q rather than from the note text directly.
Owned-campus megawatt figures throughout Appendix B are estimates. Only the Structure C sites carry disclosed megawatts.
The 2Q26 net income of $112bn includes a $99bn unrealized gain on Anthropic and SpaceX marks. Nothing in this note is built on it.
The Koyfin consensus free cash flow line does not equal the same screen’s cash from operations less capex, with a gap of about $39BN in 2029. Both are shown where relevant.
The backlog series has a definitional break. The first quarter of 2026 added contracts with an original term of one year or less, worth about $7.3bn. The move from $240bn to $462bn is 97% bookings.
Conversions from chip-hour prices to revenue per gigawatt-year assume 714,000 accelerators per gigawatt at 1.4 kilowatts all-in. That assumption drives the result and is stated wherever it is used.
DISCLOSURE
Position: At the time of publication, the author holds a position in GOOGL.
Trading Policy: The author will not materially alter this position within 48 hours of publication. After this period, the author may buy, sell, or otherwise adjust the position without further notice. Changes to the author’s view or position will be reflected in subsequent publications when material.
Conflicts: The author has received no compensation from the issuer or any party with a financial interest in this security.
Forward-Looking Statements: This report contains the author’s opinions, estimates, and projections, including price targets derived from financial models. These are forward-looking statements subject to substantial uncertainty. If these assumptions prove incorrect, the actual value may differ materially, including scenarios of significant loss or total impairment. The price target represents the author’s estimate of fair value under the stated assumptions, not a prediction of where the stock will trade.
This report is provided for informational purposes only and does not constitute investment advice. See the full Terms & Disclosures for additional important information.